HOT TOPICS LIST
- MACD
- Fibonacci
- RSI
- Gann
- ADXR
- Stochastics
- Volume
- Triangles
- Futures
- Cycles
- Volatility
- ZIGZAG
- MESA
- Retracement
- Aroon
INDICATORS LIST
LIST OF TOPICS
PRINT THIS ARTICLE
by Arthur Hill
The Dow Jones Industrial Average remains in a strong uptrend, but this key average just hit a massive resistance zone, and a pullback may be in order.
Position: N/A
Arthur Hill
Arthur Hill is currently editor of TDTrader.com, a website specializing in trading strategies, sector/industry specific breadth stats and overall technical analysis. He passed the Society of Technical Analysts (STA London) diploma exam with distinction is a Certified Financial Technician (CFTe). Prior to TD Trader, he was the Chief Technical Analyst for Stockcharts.com and the main contributor to the ChartSchool.
PRINT THIS ARTICLE
RESISTANCE LINE
DJIA Hits Massive Resistance
05/11/06 01:21:17 PMby Arthur Hill
The Dow Jones Industrial Average remains in a strong uptrend, but this key average just hit a massive resistance zone, and a pullback may be in order.
Position: N/A
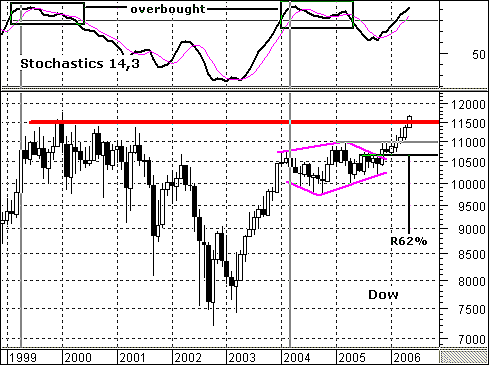
| The monthly chart (Figure 1) captures the Dow Jones Industrial Average (DJIA) from 1999 to the present. Some say that the DJIA has gone nowhere. Indeed, if you were to have gone to sleep in June 1999 and woken up today, the DJIA would be virtually unchanged. However, the DJIA dipped below 7500 (-35%) and surged back above 11500 (+57%) in the intervening years. Each move lasted two and a half to three years, and the swings were big enough to make a tidy profit coming down and going back up. |

|
| FIGURE 1: DJIA, MONTHLY. June 1999 and the present has seen the average with similar levels. |
| Graphic provided by: MetaStock. |
| Graphic provided by: MS Quotecenter. |
| |
| After a big surge in 2003, the DJIA consolidated with a big diamond that extended for almost two years (2004–05). The DJIA broke diamond resistance in November 2005 and moved toward its prior highs. The breakout is clearly bullish, but the DJIA has gotten a little overextended and 11500 looks like a formidable barrier. This area marked resistance May 1999 to June 2001 (over two years). In addition, the monthly stochastic oscillator (14) moved above 90 for the third time in eight years. The 80 level indicates the situation as being overbought and the move above 90 is even more overbought. The last two times that the stochastic oscillator moved above 80, it remained overbought for over a year (green boxes). |
| What now for the DJIA? The average is clearly in a long-term uptrend, but overbought and near resistance. In addition, the DJIA is up over 16% in the last 12 months, and this argues for a pullback. Broken resistance around 10600–10700 turns into support, and this area also marks a 62% retracement of the April 2005 to May 2006 advance. There is also support around 11000 from broken resistance and the 50% retracement. Taken together, I would venture that there is a support zone around 10600–11000, and a pullback to this area may provide an opportunity to hop on the bull again. |
Arthur Hill is currently editor of TDTrader.com, a website specializing in trading strategies, sector/industry specific breadth stats and overall technical analysis. He passed the Society of Technical Analysts (STA London) diploma exam with distinction is a Certified Financial Technician (CFTe). Prior to TD Trader, he was the Chief Technical Analyst for Stockcharts.com and the main contributor to the ChartSchool.
| Title: | Editor |
| Company: | TDTrader.com |
| Address: | Willem Geetsstraat 17 |
| Mechelen, B2800 | |
| Phone # for sales: | 3215345465 |
| Website: | www.tdtrader.com |
| E-mail address: | arthurh@tdtrader.com |
Traders' Resource Links | |
| TDTrader.com has not added any product or service information to TRADERS' RESOURCE. | |
Click here for more information about our publications!
Comments
Date: 05/13/06Rank: 4Comment:
Date: 05/16/06Rank: 5Comment:
Date: 05/16/06Rank: 5Comment:

Request Information From Our Sponsors
- VectorVest, Inc.
- Executive Premier Workshop
- One-Day Options Course
- OptionsPro
- Retirement Income Workshop
- Sure-Fire Trading Systems (VectorVest, Inc.)
- Trading as a Business Workshop
- VectorVest 7 EOD
- VectorVest 7 RealTime/IntraDay
- VectorVest AutoTester
- VectorVest Educational Services
- VectorVest OnLine
- VectorVest Options Analyzer
- VectorVest ProGraphics v6.0
- VectorVest ProTrader 7
- VectorVest RealTime Derby Tool
- VectorVest Simulator
- VectorVest Variator
- VectorVest Watchdog
- StockCharts.com, Inc.
- Candle Patterns
- Candlestick Charting Explained
- Intermarket Technical Analysis
- John Murphy on Chart Analysis
- John Murphy's Chart Pattern Recognition
- John Murphy's Market Message
- MurphyExplainsMarketAnalysis-Intermarket Analysis
- MurphyExplainsMarketAnalysis-Visual Analysis
- StockCharts.com
- Technical Analysis of the Financial Markets
- The Visual Investor
