HOT TOPICS LIST
- MACD
- Fibonacci
- RSI
- Gann
- ADXR
- Stochastics
- Volume
- Triangles
- Futures
- Cycles
- Volatility
- ZIGZAG
- MESA
- Retracement
- Aroon
INDICATORS LIST
LIST OF TOPICS
PRINT THIS ARTICLE
by Paolo Pezzutti
After the breakout of the neckline on heavy volume, the stock gains momentum to the upside.
Position: N/A
Paolo Pezzutti
Author of the book "Trading the US Markets - A Comprehensive Guide to US Markets for International Traders and Investors" - Harriman House (July 2008)
PRINT THIS ARTICLE
HEAD & SHOULDERS
Coca-Cola: Bullish Head & Shoulders
05/11/06 09:04:53 AMby Paolo Pezzutti
After the breakout of the neckline on heavy volume, the stock gains momentum to the upside.
Position: N/A
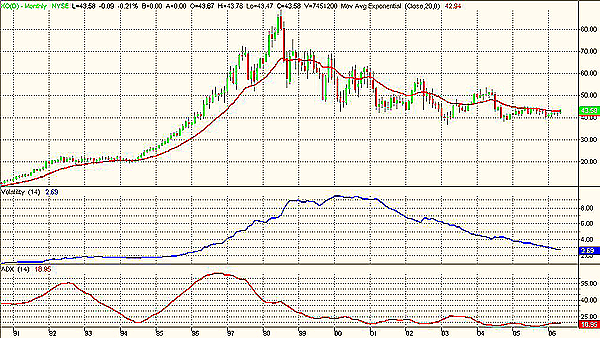
| After Coca-Cola's (KO) top of 1998 at $88.94, prices started a long correction that retraced 50% of its value. Volatility and directionality have been decreasing over time. In Figure 1, you can see that volatility (blue indicator) is at its lowest level since May 1996. The average directional movement index (ADX), which measures directionality, has a value of 18.95, typical of a sideways phase. You should expect a sharp increase in volatility in these situations, although these conditions can last several months. |

|
| FIGURE 1: COCA-COLA, MONTHLY. KO presents very low levels of volatility and directionality. |
| Graphic provided by: TradeStation. |
| |
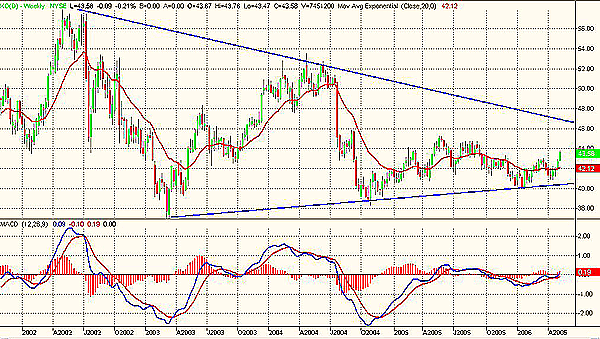
| In the weekly time frame (Figure 2), you can see that prices have been moving within two converging trendlines, a sort of symmetrical triangle. The stock is approaching the apex of the formation. The $44-45 area represents a resistance toward the upper trendline test. The moving average convergence/divergence (MACD) indicates, at the moment, a lack of momentum to the upside. However, during the past weeks, prices have shown that support levels at $40 are strong and can provide a solid base to an upside move. |

|
| FIGURE 2: COCA-COLA, WEEKLY. The stock is approaching the apex of a converging formation. |
| Graphic provided by: TradeStation. |
| |
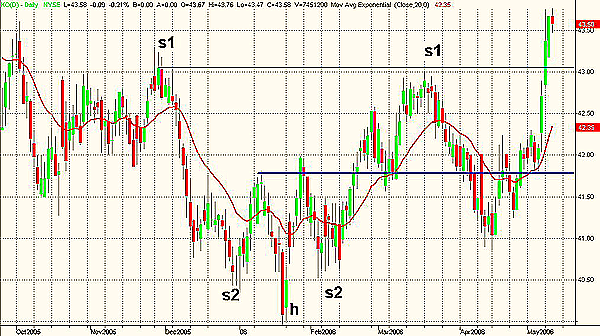
| In the daily time frame (Figure 3), KO has printed a head & shoulders formation. You can see that you have a complex formation composed of two shoulders. Following the breakout of the S2 neckline, the first objective has reached at the $43 value. After a long correction, during the last week, the stock has accelerated to the upside and managed to break out from the resistance of the S1 neckline. During the next few sessions, it is important to confirm the breakout. Buying at the breakout is an option. However, waiting for the next pullback to enter the trade provides more confidence about the possibility of prices to continue higher. |

|
| FIGURE 3: COCA-COLA, DAILY. A head & shoulders on the daily time frame has an objective of $46. |
| Graphic provided by: TradeStation. |
| |
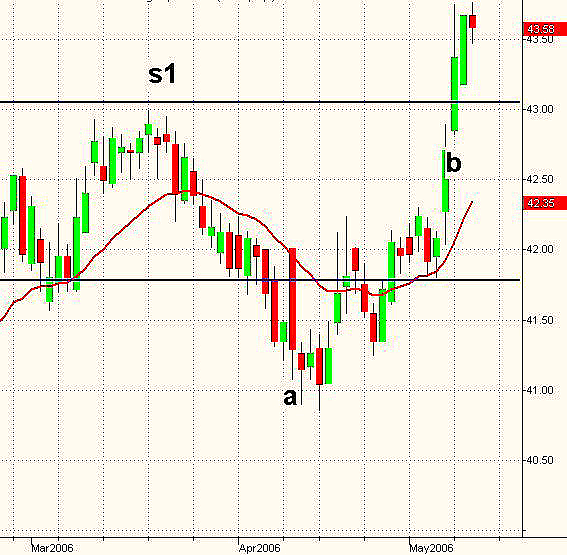
| In Figure 4, at points A and B the stock printed two wide-ranging days. This pattern is significant and it occurs when volatility exceeds the average volatility of the past n days. Printed after a long decline, this pattern can signal the end of the downtrend. During an established trend, it indicates a further acceleration of prices to new highs. Generally, it indicates the future market direction. The wide-ranging bar at point A that occurred on April 11 was followed by four bars of congestion. The stock moved suddenly to the upside, negating the bar's indications. The failure of the pattern trapped the public that participated emotionally in the directional trend day, which has seen their positions become losers. This caused further acceleration to the upside. The wide-ranging bar at point B occurred in coincidence of the breakout of the head & shoulders neckline on heavy volume. It indicates higher prices ahead, and its low is an important psychological support. Its breakout during the next session could provide an additional entry point. Often, these bars initiate short-term congestion areas. It is important to spot them as soon as possible and act consequently. Risk management trading in high-volatility conditions is very important. |

|
| FIGURE 4: COCA-COLA, DAILY. The breakout of the neckline occurred on a trend day on heavy volume. An trade entry is possible should a pullback occur in the coming sessions. |
| Graphic provided by: TradeStation. |
| |
Author of the book "Trading the US Markets - A Comprehensive Guide to US Markets for International Traders and Investors" - Harriman House (July 2008)
| Address: | VIA ROBERTO AGO 26 POSTAL CODE 00166 |
| Rome, ITALY | |
| Phone # for sales: | +393357540708 |
| E-mail address: | pezzutti.paolo@tiscali.it |
Click here for more information about our publications!
Comments
Date: 05/13/06Rank: 4Comment:

|

Request Information From Our Sponsors
- VectorVest, Inc.
- Executive Premier Workshop
- One-Day Options Course
- OptionsPro
- Retirement Income Workshop
- Sure-Fire Trading Systems (VectorVest, Inc.)
- Trading as a Business Workshop
- VectorVest 7 EOD
- VectorVest 7 RealTime/IntraDay
- VectorVest AutoTester
- VectorVest Educational Services
- VectorVest OnLine
- VectorVest Options Analyzer
- VectorVest ProGraphics v6.0
- VectorVest ProTrader 7
- VectorVest RealTime Derby Tool
- VectorVest Simulator
- VectorVest Variator
- VectorVest Watchdog
- StockCharts.com, Inc.
- Candle Patterns
- Candlestick Charting Explained
- Intermarket Technical Analysis
- John Murphy on Chart Analysis
- John Murphy's Chart Pattern Recognition
- John Murphy's Market Message
- MurphyExplainsMarketAnalysis-Intermarket Analysis
- MurphyExplainsMarketAnalysis-Visual Analysis
- StockCharts.com
- Technical Analysis of the Financial Markets
- The Visual Investor
