HOT TOPICS LIST
- MACD
- Fibonacci
- RSI
- Gann
- ADXR
- Stochastics
- Volume
- Triangles
- Futures
- Cycles
- Volatility
- ZIGZAG
- MESA
- Retracement
- Aroon
INDICATORS LIST
LIST OF TOPICS
PRINT THIS ARTICLE
by Luis Ferro
Franklin Resources broke below a well-defined congestion on strong volume. The subsequent pullback to the breakout level and the formation of a dark cloud cover suggest that this would be the perfect moment to sell the stock short. However, a recently touched trendline is still a probable source of support and suggests caution.
Position: N/A
Luis Ferro
Trader and technical analyst living in Bern, Switzerland. A full member of the STA, currently enrolled in the DITA program and the CMT program.
PRINT THIS ARTICLE
CANDLESTICK CHARTING
Trend Conflict In Franklin Resources
05/10/06 09:36:17 AMby Luis Ferro
Franklin Resources broke below a well-defined congestion on strong volume. The subsequent pullback to the breakout level and the formation of a dark cloud cover suggest that this would be the perfect moment to sell the stock short. However, a recently touched trendline is still a probable source of support and suggests caution.
Position: N/A
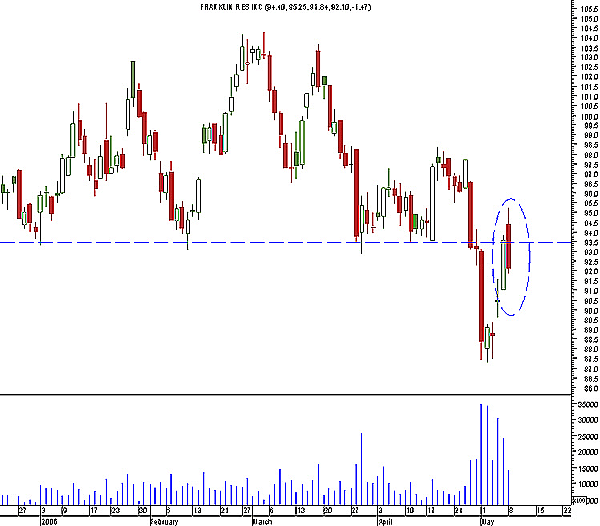
| On the daily chart (Figure 1), it is clear that Franklin Resources (BEN) has been in congestion for the last five months. The bottom limit of the congestion is very well defined, with strong support around the 93.5 level. Recently, prices again approached the 93.5 level and finally broke below the lower range of the congestion with a substantial increase in volume. Volume behavior is one of the most reliable factors in confirming the validity of a breakout, and breakouts on low volume should generally be treated with caution. Prices fell to 83.1 and returned to the breakout level in a typical pullback movement. This pullback pattern to a previous support level can often be an excellent trading opportunity because the risk-reward is normally very high, particularly if there is an indication that prices will again fall after touching the support/resistance level. |

|
| FIGURE 1: BEN, DAILY. From the looks of this price chart, Franklin Resources has been in congestion for the last five months. |
| Graphic provided by: MetaStock. |
| |
| That is exactly what occurred with BEN. A dark cloud cover pattern was formed at the support/resistance level of 93.5. This is one of the strongest candlestick reversal patterns, formed by two candlesticks. The first candle must have a strong green body, with prices opening near the bottom and closing near the top. On the second day, prices open above the previous day's top, suggesting that the bullish action will continue, but instead, prices reverse and close well within the range of the previous day's body. Normally, some call for a 50% penetration to consider the pattern valid. Much more important than an exact definition, however, is the context in which a candlestick reversal pattern is formed. It must appear following an uptrend (after all, this is a bearish reversal pattern), and it is generally stronger when it is formed at significant support/resistance levels, as in this case. |
| So in the medium term, there is a bearish breakout on strong volume, and in the short term, there is one of the strongest bearish candlestick patterns. This looks like an excellent setup for short-selling. However, even when trading in the short term, it is important to know what prices are doing in the long term. |

|
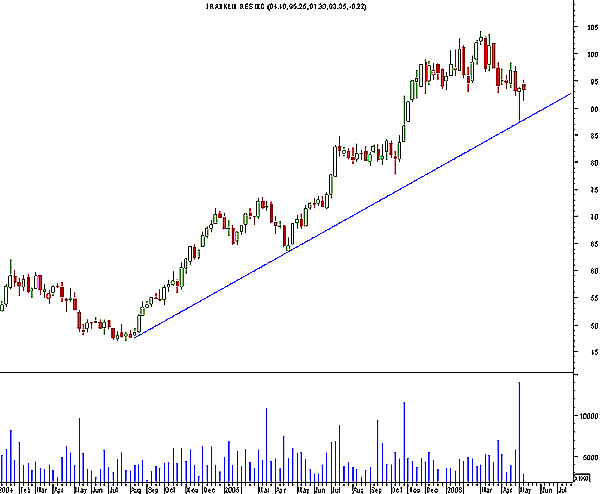
| FIGURE 2: BEN, WEEKLY. This chart shows a trendline that was tested recently. |
| Graphic provided by: MetaStock. |
| |
| The weekly chart (Figure 2) shows a trendline that was tested recently. This long-term trendline is an important support for BEN, and it is likely that any short-term bearish price movement will stop when it touches the trendline. Therefore, any short sale at this point is risky and the safest course of action is to wait until prices cross below the trendline, and all three trends--the short term, the medium term, and the long term--show patterns with bearish implications. |
Trader and technical analyst living in Bern, Switzerland. A full member of the STA, currently enrolled in the DITA program and the CMT program.
| Address: | Switzerland |
| E-mail address: | luispgsf@yahoo.com |
Click here for more information about our publications!
Comments
Date: 05/10/06Rank: 3Comment:
Date: 05/11/06Rank: 4Comment:

Request Information From Our Sponsors
- StockCharts.com, Inc.
- Candle Patterns
- Candlestick Charting Explained
- Intermarket Technical Analysis
- John Murphy on Chart Analysis
- John Murphy's Chart Pattern Recognition
- John Murphy's Market Message
- MurphyExplainsMarketAnalysis-Intermarket Analysis
- MurphyExplainsMarketAnalysis-Visual Analysis
- StockCharts.com
- Technical Analysis of the Financial Markets
- The Visual Investor
- VectorVest, Inc.
- Executive Premier Workshop
- One-Day Options Course
- OptionsPro
- Retirement Income Workshop
- Sure-Fire Trading Systems (VectorVest, Inc.)
- Trading as a Business Workshop
- VectorVest 7 EOD
- VectorVest 7 RealTime/IntraDay
- VectorVest AutoTester
- VectorVest Educational Services
- VectorVest OnLine
- VectorVest Options Analyzer
- VectorVest ProGraphics v6.0
- VectorVest ProTrader 7
- VectorVest RealTime Derby Tool
- VectorVest Simulator
- VectorVest Variator
- VectorVest Watchdog
