HOT TOPICS LIST
- MACD
- Fibonacci
- RSI
- Gann
- ADXR
- Stochastics
- Volume
- Triangles
- Futures
- Cycles
- Volatility
- ZIGZAG
- MESA
- Retracement
- Aroon
INDICATORS LIST
LIST OF TOPICS
PRINT THIS ARTICLE
by David Penn
With gold ramping to historic highs, many gold stocks remain less than enthusiastic.
Position: N/A
David Penn
Technical Writer for Technical Analysis of STOCKS & COMMODITIES magazine, Working-Money.com, and Traders.com Advantage.
PRINT THIS ARTICLE
TECHNICAL ANALYSIS
Why Aren't These Gold Stocks Smiling?
05/08/06 11:22:23 AMby David Penn
With gold ramping to historic highs, many gold stocks remain less than enthusiastic.
Position: N/A
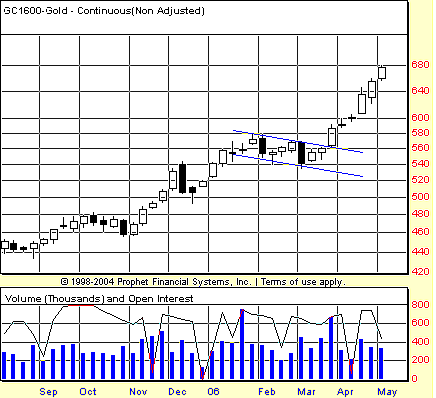
| Look at a weekly chart of gold futures (Figure 1). There is little doubt that since making a cycle low in March 2006, gold has gone virtually parabolic. While it is true that markets are never too high to buy (in legendary trader Jesse Livermore's no-less-legendary phrase), the fact that gold has rallied from a weekly closing low of $541 in mid-March to a weekly closing high near $680 by early May (basis continuous futures) means that a great deal has been accomplished in a relatively short period of time—specifically, a 25% increase in about six weeks. |

|
| FIGURE 1: CONTINUOUS GOLD FUTURES, WEEKLY. Breaking out from a sideways consolidation in late March, gold futures soared toward historic highs by late spring. |
| Graphic provided by: Prophet Financial, Inc. |
| |
So how long will these golden good times continue to roll on? There has been an interesting divergence in the gold world, one that opens up the possibility that the current move in gold bullion is likely to experience a correction that could prove to be the buying opportunity many on the sidelines have been waiting for. John J. Murphy, the father of intermarket technical analysis, has observed that typically, gold stocks lead the price of gold. While noting that this is no iron-clad axiom, that there have been instances in which the price of gold led gold stocks, Murphy suggests that the "stocks-lead-commodity" pattern is typical enough for traders to be on alert in those instances for which the pattern does not hold. He writes in the first edition of his book, Intermarket Technical Analysis:One of the key premises of intermarket analysis is the need to look to related markets for clues. Nowhere is that more evident than in the relationship between the price of gold itself and gold mining shares. As a rule, they both trend in the same direction. When they begin to diverge from one another, an early warning is being given that the trend may be changing. Usually one will lead the other at important turning points. Knowing what is happening in the leaders provides valuable information for the laggard. Many people assume that commodity prices, being the more sensitive and the more volatile of the two, lead the related stock group. It may be surprising to learn, then, that gold mining shares usually lead the price of gold. |
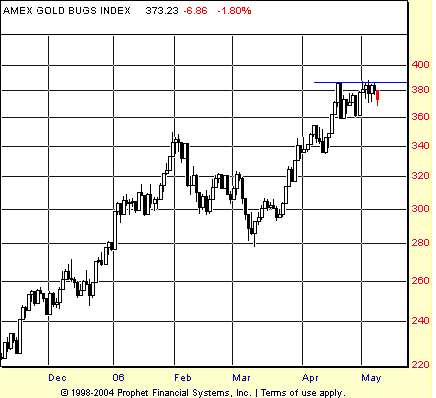
| The caveats Murphy mentions notwithstanding, it appears as if the gold market may be experiencing one of those divergences of which Murphy speaks. So far, the divergence is of the short-term variety and consists principally of the gold stocks (as measured by the index of unhedged gold shares, $HUI) failing to confirm the new monthly high in gold. That is to say that as gold (basis June futures) in May exceeded its April high, the $HUI thus far has failed to do so (Figure 2). While this divergence could be corrected in an instant, with gold mining shares buyers stepping up to the plate and bidding these stocks higher, the market currently presents investors and speculators with a question: which market is more accurately anticipating the next big move in gold—the futures or the mining stocks? |

|
| FIGURE 2: AMEX GOLD BUGS INDEX, DAILY. After a six-week correction in February and March, gold mining shares have spent another six weeks rallying to all-time highs. Yet failure to take out the April highs created a divergence from the gold futures that did so. |
| Graphic provided by: Prophet Financial, Inc. |
| |
| I suffered through this divergence first-hand a few weeks ago, trying to use Newmont Mines (NEM) as a proxy for a gold market I was convinced was heading higher. Unfortunately for me, Newmont was one of those gold stocks that was helping prevent gold indexes like the $HUI from setting a new monthly high in May vis-a-vis April. (I should point out that the other "hedged" index, the gold and silver $XAU, did in fact make a new high in May.) Other stocks did in fact move higher in May, mining shares such as Barrick (ABX) and Goldcorp (GG). But it was truly a case of a two-handed gold market in which on the one hand, there were winners come early May, and on the other hand, there were losers. |
| I should point out that gold mining shares have not necessarily confirmed gold futures; new May high doesn't mean that gold is about to crash—or even that gold is about to experience anything sharply negative. It is quite possible that both gold and gold mining shares might enter into a sideways consolidation-type of pattern, one that bores speculators into selling their shares rather than terrifying them into doing so as a sharper correction might. As investors and speculators learned about the stock market in recent months, it doesn't take sharp declines to get market sentiments roiled, and sometimes, a little nauseating back and forth is all that is needed to set up the markets for their next move higher. |
Technical Writer for Technical Analysis of STOCKS & COMMODITIES magazine, Working-Money.com, and Traders.com Advantage.
| Title: | Technical Writer |
| Company: | Technical Analysis, Inc. |
| Address: | 4757 California Avenue SW |
| Seattle, WA 98116 | |
| Phone # for sales: | 206 938 0570 |
| Fax: | 206 938 1307 |
| Website: | www.Traders.com |
| E-mail address: | DPenn@traders.com |
Traders' Resource Links | |
| Charting the Stock Market: The Wyckoff Method -- Books | |
| Working-Money.com -- Online Trading Services | |
| Traders.com Advantage -- Online Trading Services | |
| Technical Analysis of Stocks & Commodities -- Publications and Newsletters | |
| Working Money, at Working-Money.com -- Publications and Newsletters | |
| Traders.com Advantage -- Publications and Newsletters | |
| Professional Traders Starter Kit -- Software | |
Click here for more information about our publications!
Comments
Date: 05/08/06Rank: 3Comment:
Date: 05/09/06Rank: 5Comment:
Date: 05/16/06Rank: 4Comment:

Request Information From Our Sponsors
- StockCharts.com, Inc.
- Candle Patterns
- Candlestick Charting Explained
- Intermarket Technical Analysis
- John Murphy on Chart Analysis
- John Murphy's Chart Pattern Recognition
- John Murphy's Market Message
- MurphyExplainsMarketAnalysis-Intermarket Analysis
- MurphyExplainsMarketAnalysis-Visual Analysis
- StockCharts.com
- Technical Analysis of the Financial Markets
- The Visual Investor
- VectorVest, Inc.
- Executive Premier Workshop
- One-Day Options Course
- OptionsPro
- Retirement Income Workshop
- Sure-Fire Trading Systems (VectorVest, Inc.)
- Trading as a Business Workshop
- VectorVest 7 EOD
- VectorVest 7 RealTime/IntraDay
- VectorVest AutoTester
- VectorVest Educational Services
- VectorVest OnLine
- VectorVest Options Analyzer
- VectorVest ProGraphics v6.0
- VectorVest ProTrader 7
- VectorVest RealTime Derby Tool
- VectorVest Simulator
- VectorVest Variator
- VectorVest Watchdog
