HOT TOPICS LIST
- MACD
- Fibonacci
- RSI
- Gann
- ADXR
- Stochastics
- Volume
- Triangles
- Futures
- Cycles
- Volatility
- ZIGZAG
- MESA
- Retracement
- Aroon
INDICATORS LIST
LIST OF TOPICS
PRINT THIS ARTICLE
by Paolo Pezzutti
In the daily time frame for Apple Computer, the bullish reversal formation now needs confirmation with a breakout of the neckline.
Position: Accumulate
Paolo Pezzutti
Author of the book "Trading the US Markets - A Comprehensive Guide to US Markets for International Traders and Investors" - Harriman House (July 2008)
PRINT THIS ARTICLE
HEAD & SHOULDERS
Bullish Head & Shoulders For Apple
05/08/06 08:33:30 AMby Paolo Pezzutti
In the daily time frame for Apple Computer, the bullish reversal formation now needs confirmation with a breakout of the neckline.
Position: Accumulate
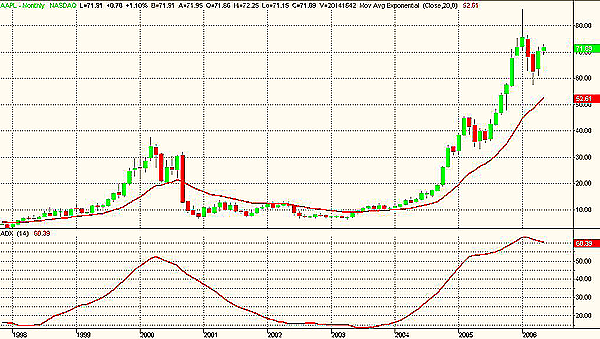
| The monthly chart of Apple Computer (AAPL) is impressive (Figure 1). The times when the stock was lingering in the $10 area back in 2001–04 seem very long ago. In the two years since, AAPL has multiplied its value by eight times, thanks to the success of the company's IPod and other innovative products. After the dramatic surge of prices of last year, the intermediate-term top was printed in January 2006. Since then, a corrective phase has been initiated that brought prices around the $58 level. In this time frame, there is still strong momentum. In Figure 1, I have displayed the average directional movement index (ADX). The ADX measures the trend quality of a security, independent of direction; the greater the ADX value, the stronger a security is trending. Traditionally, values above 30 are assumed to indicate an ongoing trend. It is unusual to see a trend reversal during these phases. You can see that its value is still above 60, at extremely high values. In this situation, I would expect a tentative retest of the previous high. |

|
| FIGURE 1: APPLE COMPUTER, MONTHLY. AAPL prints a very high ADX, indicating a strong uptrend. |
| Graphic provided by: TradeStation. |
| |
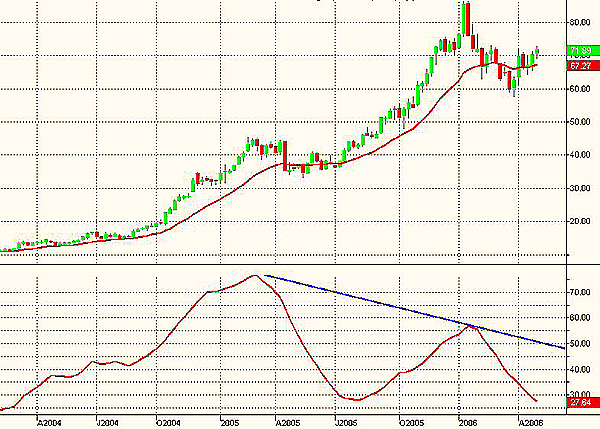
| In the weekly time frame (Figure 2), you can see that during the third week of January 2006, the stock printed a long black candle that canceled the previous week's significant advance of prices. With this candle, a significant resistance was set to indicate that it will be quite difficult to print new highs. At the end of a long uptrend, these bars often represent significant pivot points. The following fast correction brought prices below the $60 level, with prices about 25% lower. You can see that the ADX displays a very significant divergence. At the moment, its value is about 27 and still decreasing. This fact indicates the current reduced directionality of prices in the intermediate term. I expect that the stock will remain in the $60–85 range in the next few months, unless an unlikely event occurs. |

|
| FIGURE 2: APPLE COMPUTER, WEEKLY. In this case, the ADX is decreasing. In this time frame, the lack of directionality should continue for AAPL. |
| Graphic provided by: TradeStation. |
| |
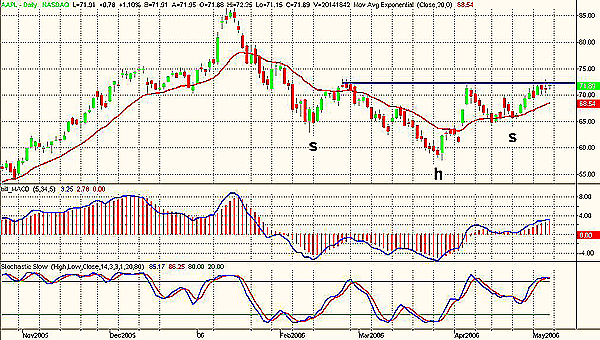
| The daily time frame is interesting (Figure 3). Here, the stock has developed a bullish head & shoulders pattern, one of the most famous chart formations. Typically, it is accepted as a major reversal indicator. This pattern is developed with a strong downward breakout, reaching new lows on increased volume. Then, a consolidation area forms with diminishing volume. This can look much like a flag or a triangle. After that, another downward breakout forms the head, usually on continued reduced volume. This is the key point of the formation. The new low is not confirmed by increased volume, and prices move to the upside quickly. A last move forms the right shoulder and is the third attempt at new lows for the move. Three approaches can be proposed to trading a head & shoulders: - Buy at the breakout of the neckline. Place a stop-loss below the right shoulder or the head. - Buy on the first correction after the neckline is broken. Same stop-loss as above. - Buy when the right shoulder is being formed. A stop-loss can be placed below the low of the head. Thomas Bulkowski, in his Encyclopedia Of Chart Patterns, claims that this formation is highly reliable once confirmed. He shows statistics to demonstrate it. The way you decide to trade the pattern presents different levels of anticipation, associated with different risk–reward opportunities. It is up to your trading style to decide whether to enter the trade with higher probabilities of success but lower potential returns, or try to anticipate the confirmation of the pattern and risk being stopped out more frequently. |

|
| FIGURE 3: APPLE COMPUTER, DAILY. AAPL's bullish head & shoulders pattern seen here has an objective at $84. |
| Graphic provided by: TradeStation. |
| |
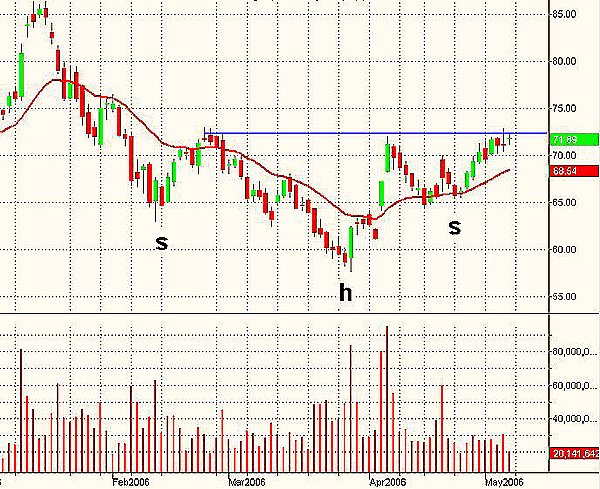
| AAPL has completed the head & shoulders formation and prices are testing the neckline. This phase is critical. At this point, you would expect a breakout of the neckline with increased volume. If this does not occur, the most likely scenario is the development of a trading range environment with prices moving to test lower supports. So far, momentum is low and the stochastic is overbought. Prices have approached the resistance level with low volatility and low directionality. It is an uncertain phase that will be resolved in the upcoming trading sessions. |

|
| FIGURE 4: APPLE COMPUTER, DAILY. Prices are testing the neckline of the formation. This phase is critical to see if the stock can gain momentum to the upside. |
| Graphic provided by: TradeStation. |
| |
Author of the book "Trading the US Markets - A Comprehensive Guide to US Markets for International Traders and Investors" - Harriman House (July 2008)
| Address: | VIA ROBERTO AGO 26 POSTAL CODE 00166 |
| Rome, ITALY | |
| Phone # for sales: | +393357540708 |
| E-mail address: | pezzutti.paolo@tiscali.it |
Click here for more information about our publications!
Comments
Date: 05/08/06Rank: 3Comment:

Request Information From Our Sponsors
- StockCharts.com, Inc.
- Candle Patterns
- Candlestick Charting Explained
- Intermarket Technical Analysis
- John Murphy on Chart Analysis
- John Murphy's Chart Pattern Recognition
- John Murphy's Market Message
- MurphyExplainsMarketAnalysis-Intermarket Analysis
- MurphyExplainsMarketAnalysis-Visual Analysis
- StockCharts.com
- Technical Analysis of the Financial Markets
- The Visual Investor
- VectorVest, Inc.
- Executive Premier Workshop
- One-Day Options Course
- OptionsPro
- Retirement Income Workshop
- Sure-Fire Trading Systems (VectorVest, Inc.)
- Trading as a Business Workshop
- VectorVest 7 EOD
- VectorVest 7 RealTime/IntraDay
- VectorVest AutoTester
- VectorVest Educational Services
- VectorVest OnLine
- VectorVest Options Analyzer
- VectorVest ProGraphics v6.0
- VectorVest ProTrader 7
- VectorVest RealTime Derby Tool
- VectorVest Simulator
- VectorVest Variator
- VectorVest Watchdog
