HOT TOPICS LIST
- MACD
- Fibonacci
- RSI
- Gann
- ADXR
- Stochastics
- Volume
- Triangles
- Futures
- Cycles
- Volatility
- ZIGZAG
- MESA
- Retracement
- Aroon
INDICATORS LIST
LIST OF TOPICS
PRINT THIS ARTICLE
by Koos van der Merwe
Here are some adages to remember: "Sell in May and go away." "The second year of a Presidential cycle sees the most corrections."
Position: Sell
Koos van der Merwe
Has been a technical analyst since 1969, and has worked as a futures and options trader with First Financial Futures in Johannesburg, South Africa.
PRINT THIS ARTICLE
GANN
The Elusive B-Wave Of The S&P Index
05/04/06 11:32:34 AMby Koos van der Merwe
Here are some adages to remember: "Sell in May and go away." "The second year of a Presidential cycle sees the most corrections."
Position: Sell
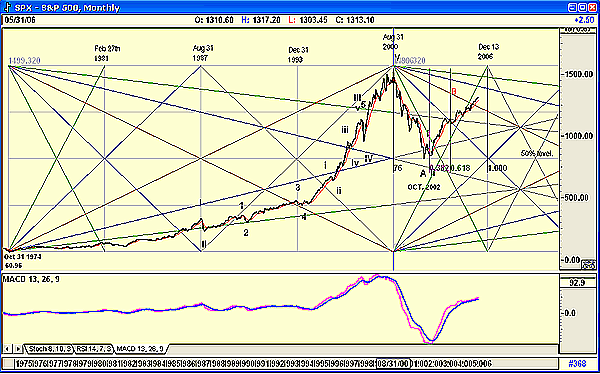
| There are many more such maxims, but do they apply this time around? Yes. I have been watching what I believe is the development of an Elliott B-wave on monthly charts. B-wave tops are notoriously difficult to forecast and can even exceed the top of the previous wave V. The present B-wave in the Standard & Poor's 500 monthly chart is just as awkward, and the moving average convergence/divergence (MACD) shown in Figure 1 continually teases the analyst into believing that the turn is near. |
| So to find out the truth, I turned to that mysterious analyst, WD Gann. When he died, he left a study full of strategies, from the astrological to the mathematical, but he never really left any sign about the strategy he used that gave him his phenomenal success in the market. In Figure 1, I have chosen Gann squares in an attempt to determine when (if I am correct in believing that the S&P is truly tracing a B-wave) the index and the market in the US will start the collapse into a devastating wave C. |

|
| FIGURE 1: S&P 500 WITH GANN BOXES, MONTHLY. Gann squares determine when the index and the US market will start the collapse into a devastating wave C. |
| Graphic provided by: AdvancedGET. |
| |
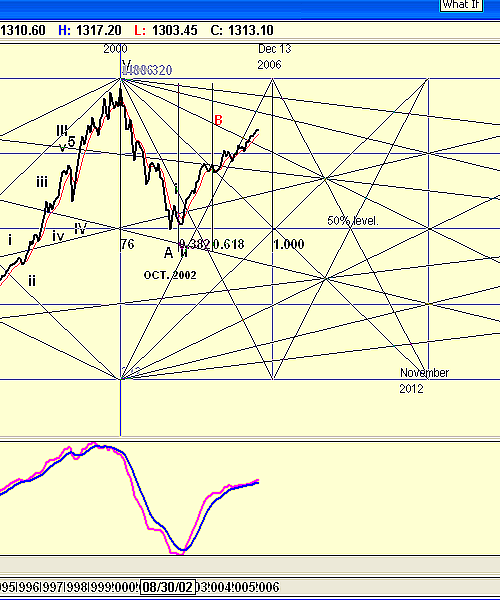
| The Gann square, or box as it is more commonly known, has become a standard in most programs today. In Figure 1, I have drawn a Gann 1x1 angle from the low of October 31, 1974, to the high of August 31, 2000. The program automatically completes the Gann boxes as shown. What I find interesting is that all the Gann boxes highlighted a high in February 1981, August 1987, and December 1993. Further, the index fell to the 50% level on October 2002, with a double bottom at the 38.2% Fibonacci ratio time period at A. It is now rising in a B-wave with a projected time line of December 2006 for a top, with the C-wave collapse into November 2012, as shown in Figure 2. |

|
| FIGURE 2: S&P 500. The index is now rising in a B-wave with a projected time line of December 2006 for a top, with the C-wave collapse into November 2012. |
| Graphic provided by: AdvancedGET. |
| |
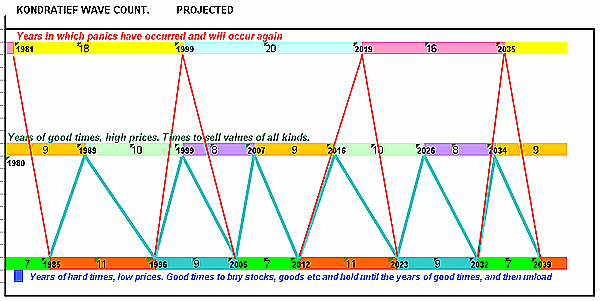
| What is even more surprising is that all these forecasts tie in with my Kondratieff wave count, as shown in Figure 3. |

|
| FIGURE 3: KONDRATIEFF WAVE. Amazingly, the Gann predictions tie in with the Kondratieff wave count. |
| Graphic provided by: Excel Spread sheet.. |
| |
| Are the negative forecasts by the experts correct? It sure looks like it, but they may be six months too early. But to be on the safe side, do sell in May, and enjoy a worry-free holiday. |
Has been a technical analyst since 1969, and has worked as a futures and options trader with First Financial Futures in Johannesburg, South Africa.
| Address: | 3256 West 24th Ave |
| Vancouver, BC | |
| Phone # for sales: | 6042634214 |
| E-mail address: | petroosp@gmail.com |
Click here for more information about our publications!
Comments
Date: 05/04/06Rank: 2Comment:

Request Information From Our Sponsors
- StockCharts.com, Inc.
- Candle Patterns
- Candlestick Charting Explained
- Intermarket Technical Analysis
- John Murphy on Chart Analysis
- John Murphy's Chart Pattern Recognition
- John Murphy's Market Message
- MurphyExplainsMarketAnalysis-Intermarket Analysis
- MurphyExplainsMarketAnalysis-Visual Analysis
- StockCharts.com
- Technical Analysis of the Financial Markets
- The Visual Investor
- VectorVest, Inc.
- Executive Premier Workshop
- One-Day Options Course
- OptionsPro
- Retirement Income Workshop
- Sure-Fire Trading Systems (VectorVest, Inc.)
- Trading as a Business Workshop
- VectorVest 7 EOD
- VectorVest 7 RealTime/IntraDay
- VectorVest AutoTester
- VectorVest Educational Services
- VectorVest OnLine
- VectorVest Options Analyzer
- VectorVest ProGraphics v6.0
- VectorVest ProTrader 7
- VectorVest RealTime Derby Tool
- VectorVest Simulator
- VectorVest Variator
- VectorVest Watchdog
