HOT TOPICS LIST
- MACD
- Fibonacci
- RSI
- Gann
- ADXR
- Stochastics
- Volume
- Triangles
- Futures
- Cycles
- Volatility
- ZIGZAG
- MESA
- Retracement
- Aroon
INDICATORS LIST
LIST OF TOPICS
PRINT THIS ARTICLE
by David Penn
Does the triangular consolidation in the hourly chart of the S&P 500 suggest that a significant move to the upside is likely in the near term?
Position: N/A
David Penn
Technical Writer for Technical Analysis of STOCKS & COMMODITIES magazine, Working-Money.com, and Traders.com Advantage.
PRINT THIS ARTICLE
BREAKOUTS
Bucking For A Breakout?
05/03/06 01:20:26 PMby David Penn
Does the triangular consolidation in the hourly chart of the S&P 500 suggest that a significant move to the upside is likely in the near term?
Position: N/A
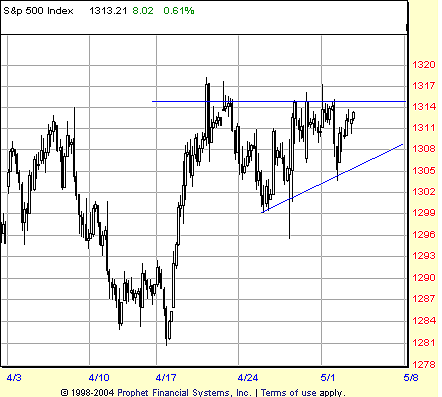
| I'm deliberately referring to the price action in the Standard & Poor's 500 as "triangular" as opposed to going ahead and calling it a "triangle" or "ascending triangle" in part because, at this point, the consolidation appears to be as large or larger than the uptrend that created it. Specifically, I'm referring to the sideways consolidation that, since the low in late April, has consisted of higher lows and a consistent, horizontal resistance level. It is the combination of these two features—higher lows and a consistent, horizontal resistance level—that characterize ascending triangles. But for now, I'll continue to hedge by simply referring to the pattern enclosed by the blue converging trendlines in Figure 1 as "triangular." |

|
| FIGURE 1: STANDARD & POOR'S 500, HOURLY. The triangular consolidation that has developed over the past several days could be the prelude to a sharp move higher, not unlike the near-vertical rally in mid-April that led to the end-of-the-month consolidation. |
| Graphic provided by: Prophet Financial, Inc. |
| |
| In describing the characteristics of an ascending triangle in his book Encyclopedia Of Chart Patterns, Thomas Bulkowski notes the importance that "prices rise up to and fall away from a horizontal resistance line at least twice (two minor highs)." Although I've shied away from calling this consolidation an "ascending triangle," it is clear that the consolidation shown in Figure 1 does possess those two minor highs. For that matter, the pattern also possesses the "two minor lows" that Bulkowski goes on to say are key to an ascending triangle pattern. Combined with the upwardly sloping support line and the horizontal resistance line, these four boundary "touches" help build a credible case that the triangular consolidation may be—or at least behave like—an ascending triangle. |
| Ascending triangles tend to be bullish continuation patterns—that is to say, when they appear, an uptrend is typically already in place. The triangle serves as an accumulation/distribution zone during which strong hands enjoin the temporarily stalled rally and weak hands tend to abandon it. A breakout to the upside above the horizontal resistance line spells the end of the accumulation/distribution period and a resumption of the uptrend. |

|
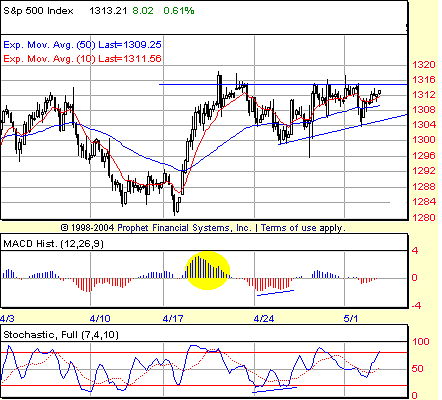
| FIGURE 2: STANDARD & POOR'S 500, HOURLY. The MACD histogram spike sets a bullish tone to the sharp, mid-April rally. Positive divergences in the MACD histogram and stochastic days afterward underscore the pullback in late April as a likely buying opportunity. |
| Graphic provided by: Prophet Financial, Inc. |
| |
| Aside from the shape of the consolidation, there is additional evidence that the S&P 500 might move higher in the near term. The first piece of evidence comes from the size and direction of the moving average convergence/divergence (MACD) histogram highlighted in Figure 2. This MACD histogram spike, strongly positive and towering over other recently positive histograms, suggests a great deal of buying strength and a likelihood that the price highs that appeared along with this MACD histogram spike will be exceeded before the uptrend is over. Additional signs that the S&P 500 has made a low from which a rally might arise comes in the form of the positive divergences in the MACD histogram and stochastic as the S&P 500 makes its correction low in late April. These divergences suggest that this correction low was a tradable bottom that should last long enough for a significant move to the upside to occur. |
| What kind of "significant move to the upside" might be expected from a successful breakout from this triangular consolidation? Measured at its widest point, the consolidation is approximately 16 points wide which, when added to the value at the horizontal resistance, provides for a minimum upside projection to the 1332 area. Such a move would return the S&P 500 to levels not seen since February 2001—a few weeks after George W. Bush was sworn in to serve his first term as President. |
Technical Writer for Technical Analysis of STOCKS & COMMODITIES magazine, Working-Money.com, and Traders.com Advantage.
| Title: | Technical Writer |
| Company: | Technical Analysis, Inc. |
| Address: | 4757 California Avenue SW |
| Seattle, WA 98116 | |
| Phone # for sales: | 206 938 0570 |
| Fax: | 206 938 1307 |
| Website: | www.Traders.com |
| E-mail address: | DPenn@traders.com |
Traders' Resource Links | |
| Charting the Stock Market: The Wyckoff Method -- Books | |
| Working-Money.com -- Online Trading Services | |
| Traders.com Advantage -- Online Trading Services | |
| Technical Analysis of Stocks & Commodities -- Publications and Newsletters | |
| Working Money, at Working-Money.com -- Publications and Newsletters | |
| Traders.com Advantage -- Publications and Newsletters | |
| Professional Traders Starter Kit -- Software | |
Click here for more information about our publications!
Comments
Date: 05/03/06Rank: 3Comment:
Date: 05/04/06Rank: 5Comment:

Request Information From Our Sponsors
- StockCharts.com, Inc.
- Candle Patterns
- Candlestick Charting Explained
- Intermarket Technical Analysis
- John Murphy on Chart Analysis
- John Murphy's Chart Pattern Recognition
- John Murphy's Market Message
- MurphyExplainsMarketAnalysis-Intermarket Analysis
- MurphyExplainsMarketAnalysis-Visual Analysis
- StockCharts.com
- Technical Analysis of the Financial Markets
- The Visual Investor
- VectorVest, Inc.
- Executive Premier Workshop
- One-Day Options Course
- OptionsPro
- Retirement Income Workshop
- Sure-Fire Trading Systems (VectorVest, Inc.)
- Trading as a Business Workshop
- VectorVest 7 EOD
- VectorVest 7 RealTime/IntraDay
- VectorVest AutoTester
- VectorVest Educational Services
- VectorVest OnLine
- VectorVest Options Analyzer
- VectorVest ProGraphics v6.0
- VectorVest ProTrader 7
- VectorVest RealTime Derby Tool
- VectorVest Simulator
- VectorVest Variator
- VectorVest Watchdog
