HOT TOPICS LIST
- MACD
- Fibonacci
- RSI
- Gann
- ADXR
- Stochastics
- Volume
- Triangles
- Futures
- Cycles
- Volatility
- ZIGZAG
- MESA
- Retracement
- Aroon
INDICATORS LIST
LIST OF TOPICS
PRINT THIS ARTICLE
by Arthur Hill
Massey Energy was poised to move lower after a support break, but managed to firm and recover with a gap on good volume.
Position: Buy
Arthur Hill
Arthur Hill is currently editor of TDTrader.com, a website specializing in trading strategies, sector/industry specific breadth stats and overall technical analysis. He passed the Society of Technical Analysts (STA London) diploma exam with distinction is a Certified Financial Technician (CFTe). Prior to TD Trader, he was the Chief Technical Analyst for Stockcharts.com and the main contributor to the ChartSchool.
PRINT THIS ARTICLE
GAPS
Bear Trap Bodes Bull For Massey
05/03/06 08:07:17 AMby Arthur Hill
Massey Energy was poised to move lower after a support break, but managed to firm and recover with a gap on good volume.
Position: Buy
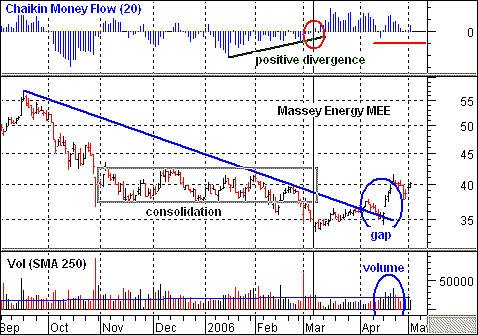
| On the daily price chart shown in Figure 1, Massey Energy (MEE) declined below 40 in late October and then consolidated over the next three months. This consolidation formed a rectangle and the stock broke support in February and again in March (gray box). Things were looking pretty bleak after this support break and the downside target was the low 30s. |

|
| FIGURE 1: MASSEY ENERGY, DAILY. MEE declined below the 40 level in late October and then consolidated over the following three months. |
| Graphic provided by: MetaStock. |
| Graphic provided by: MS QuoteCenter. |
| |
| Instead of continuing lower, the stock managed to firm in early March and surged back above its support break in mid-April (blue circle). This surge featured a gap and above-average volume. It was a classic bear trap, and the foundation for a move higher has been laid. A weak move back above the support break would have been suspect, but this move was clearly strong. The gap should be considered bullish as long as it holds and it would take a move below 35 to negate this reversal. |
| Note that the Chaikin money flow (CMF) indicator held relatively strong after the support breaks in February and early March. This volume-based indicator measures buying and selling pressure. While the stock moved to a new low, this oscillator formed a higher low and was trading near positive territory (red oval). The indicator moved into positive territory as soon as the stock bottomed and has remained largely positive ever since. The effects of the late April volume surge are wearing thin now, but I would not worry unless CMF moved below -10% (red line). |
Arthur Hill is currently editor of TDTrader.com, a website specializing in trading strategies, sector/industry specific breadth stats and overall technical analysis. He passed the Society of Technical Analysts (STA London) diploma exam with distinction is a Certified Financial Technician (CFTe). Prior to TD Trader, he was the Chief Technical Analyst for Stockcharts.com and the main contributor to the ChartSchool.
| Title: | Editor |
| Company: | TDTrader.com |
| Address: | Willem Geetsstraat 17 |
| Mechelen, B2800 | |
| Phone # for sales: | 3215345465 |
| Website: | www.tdtrader.com |
| E-mail address: | arthurh@tdtrader.com |
Traders' Resource Links | |
| TDTrader.com has not added any product or service information to TRADERS' RESOURCE. | |
Click here for more information about our publications!
Comments
Date: 05/03/06Rank: 4Comment:

Request Information From Our Sponsors
- StockCharts.com, Inc.
- Candle Patterns
- Candlestick Charting Explained
- Intermarket Technical Analysis
- John Murphy on Chart Analysis
- John Murphy's Chart Pattern Recognition
- John Murphy's Market Message
- MurphyExplainsMarketAnalysis-Intermarket Analysis
- MurphyExplainsMarketAnalysis-Visual Analysis
- StockCharts.com
- Technical Analysis of the Financial Markets
- The Visual Investor
- VectorVest, Inc.
- Executive Premier Workshop
- One-Day Options Course
- OptionsPro
- Retirement Income Workshop
- Sure-Fire Trading Systems (VectorVest, Inc.)
- Trading as a Business Workshop
- VectorVest 7 EOD
- VectorVest 7 RealTime/IntraDay
- VectorVest AutoTester
- VectorVest Educational Services
- VectorVest OnLine
- VectorVest Options Analyzer
- VectorVest ProGraphics v6.0
- VectorVest ProTrader 7
- VectorVest RealTime Derby Tool
- VectorVest Simulator
- VectorVest Variator
- VectorVest Watchdog
