HOT TOPICS LIST
- MACD
- Fibonacci
- RSI
- Gann
- ADXR
- Stochastics
- Volume
- Triangles
- Futures
- Cycles
- Volatility
- ZIGZAG
- MESA
- Retracement
- Aroon
INDICATORS LIST
LIST OF TOPICS
PRINT THIS ARTICLE
by David Penn
A massive, two-year head & shoulders bottom suggests an upside surprise for dollar bears.
Position: N/A
David Penn
Technical Writer for Technical Analysis of STOCKS & COMMODITIES magazine, Working-Money.com, and Traders.com Advantage.
PRINT THIS ARTICLE
HEAD & SHOULDERS
Death To The Death Of The Dollar
05/01/06 02:42:29 PMby David Penn
A massive, two-year head & shoulders bottom suggests an upside surprise for dollar bears.
Position: N/A
| One of my favorite trading maxims is that a market is never too high to buy and never too low to sell. That idea has certainly been on the minds of those betting against the dollar, either by shorting the US Dollar Index or, more likely, through aggressive accumulation of gold shares or currencies like the Australian dollar. At the same time, however, there is another worthwhile trading maxim that suggests, in summary, that when everybody is tilting in one direction, it is often a good time to begin looking in the opposite direction. |

|
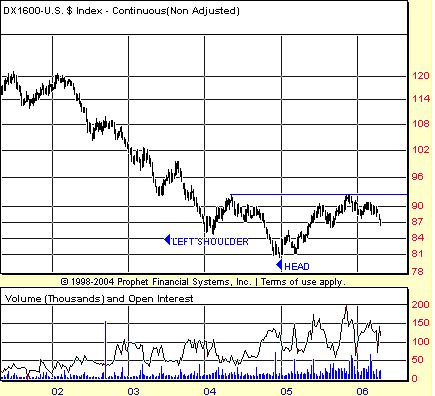
| FIGURE 1: US DOLLAR INDEX, CONTINUOUS, WEEKLY. Should this head & shoulders bottom be successfully completed, investors should be prepared for an initial upside move to at least the 105 level. |
| Graphic provided by: Prophet Financial, Inc. |
| |
| If there has been a "tilt" with regard to the US dollar over the past few years, then it has been most obviously negative. The evidence of this abounds — from rumors that the US Treasury Secretary needs to be replaced because his strong dollar rhetoric is at odds with the economic goals of the Bush administration, to the excitement surrounding the new exchange-traded fund levered to the price of silver. Silver, it should be pointed out, is often considered the "poor man's gold" insofar as when precious metals speculation gets popular, silver is often the commodity of choice for smaller, less-capitalized traders. As such, some seasoned precious metals traders become a bit concerned when the market for silver is outperforming the market for other precious metals like gold. |
| But the dollar has a story apart from the fortunes of silver and gold. And while that story has been one of relatively sharp decline since 2002 (the US Dollar Index peaked in January of that year), there are reasons to suspect that story might be adding a new and unsuspected chapter based on the price action in the greenback since late 2003–early 2004. Specifically, that price action has traced out the first two-thirds of a sizable head & shoulders bottom pattern which, if proved accurate, could see the greenback hurtling higher toward levels not seen since the autumn of 2002. |

|
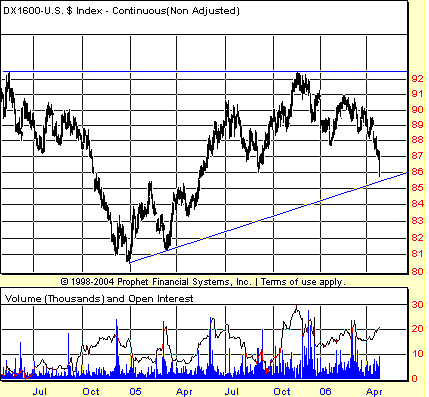
| FIGURE 2: US DOLLAR INDEX, CONTINUOUS, WEEKLY. A rendezvous with this primary trendline from the late 2004–early 2005 lows may be the greenback's best chance to find support since peaking in the autumn of 2005. |
| Graphic provided by: Prophet Financial, Inc. |
| |
| The head & shoulders bottom remains a work in progress. So far, as shown in Figure 1, the greenback has traced out both a left shoulder and a head and appears to be working on the right shoulder. In order for the right shoulder to be successfully completed, the greenback will need to find support before it reaches the lows registered by the head of the pattern (at approximately 81, basis continuous futures). After this, the greenback would need to rebound and rally past the neckline level at about 92.5 in order to have a successful breakout from the head & shoulders bottom. If all this is achieved, then the size of the pattern suggests a minimum upside rally to the 105 level — a level that has not been touched by the greenback since late 2002. |
| What are the chances of the greenback finding support before reaching 81? There is some support provided by the highs of first quarter of 2005, as well as by the highs in the first half of the second quarter. This matches up with the 85 level (again, basis continuous futures). Another potential source of support comes from the primary or initial trendline that begins with the lows in late 2004 and connects with the lows of the first quarter of 2005. When extended, as it is in Figure 2, we can see that the current decline in the US Dollar Index has moved particularly close to this source of potential support. For me, because there is the absence of technical signals (that is, positive divergences) that are currently telegraphing a bottom, this trendline stands out as the one (and only?) thing standing between the dollar and an even deeper decline. |
Technical Writer for Technical Analysis of STOCKS & COMMODITIES magazine, Working-Money.com, and Traders.com Advantage.
| Title: | Technical Writer |
| Company: | Technical Analysis, Inc. |
| Address: | 4757 California Avenue SW |
| Seattle, WA 98116 | |
| Phone # for sales: | 206 938 0570 |
| Fax: | 206 938 1307 |
| Website: | www.Traders.com |
| E-mail address: | DPenn@traders.com |
Traders' Resource Links | |
| Charting the Stock Market: The Wyckoff Method -- Books | |
| Working-Money.com -- Online Trading Services | |
| Traders.com Advantage -- Online Trading Services | |
| Technical Analysis of Stocks & Commodities -- Publications and Newsletters | |
| Working Money, at Working-Money.com -- Publications and Newsletters | |
| Traders.com Advantage -- Publications and Newsletters | |
| Professional Traders Starter Kit -- Software | |
Click here for more information about our publications!
Comments
Date: 05/02/06Rank: 3Comment:

|

Request Information From Our Sponsors
- StockCharts.com, Inc.
- Candle Patterns
- Candlestick Charting Explained
- Intermarket Technical Analysis
- John Murphy on Chart Analysis
- John Murphy's Chart Pattern Recognition
- John Murphy's Market Message
- MurphyExplainsMarketAnalysis-Intermarket Analysis
- MurphyExplainsMarketAnalysis-Visual Analysis
- StockCharts.com
- Technical Analysis of the Financial Markets
- The Visual Investor
- VectorVest, Inc.
- Executive Premier Workshop
- One-Day Options Course
- OptionsPro
- Retirement Income Workshop
- Sure-Fire Trading Systems (VectorVest, Inc.)
- Trading as a Business Workshop
- VectorVest 7 EOD
- VectorVest 7 RealTime/IntraDay
- VectorVest AutoTester
- VectorVest Educational Services
- VectorVest OnLine
- VectorVest Options Analyzer
- VectorVest ProGraphics v6.0
- VectorVest ProTrader 7
- VectorVest RealTime Derby Tool
- VectorVest Simulator
- VectorVest Variator
- VectorVest Watchdog
