HOT TOPICS LIST
- MACD
- Fibonacci
- RSI
- Gann
- ADXR
- Stochastics
- Volume
- Triangles
- Futures
- Cycles
- Volatility
- ZIGZAG
- MESA
- Retracement
- Aroon
INDICATORS LIST
LIST OF TOPICS
PRINT THIS ARTICLE
by Paolo Pezzutti
After printing multiple negative divergences during the long uptrend, this stock has initiated a fast correction.
Position: N/A
Paolo Pezzutti
Author of the book "Trading the US Markets - A Comprehensive Guide to US Markets for International Traders and Investors" - Harriman House (July 2008)
PRINT THIS ARTICLE
TECHNICAL ANALYSIS
Merrill Lynch Initiates Correction Phase
05/01/06 02:18:49 PMby Paolo Pezzutti
After printing multiple negative divergences during the long uptrend, this stock has initiated a fast correction.
Position: N/A
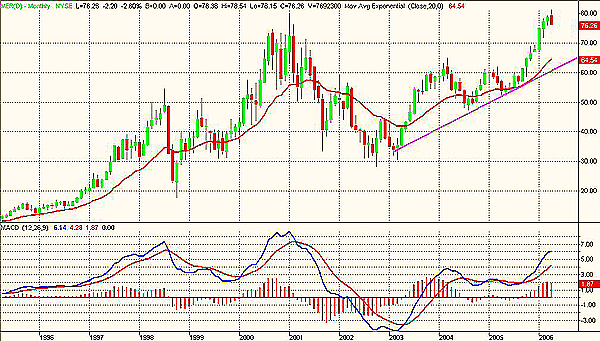
| Merrill Lynch (MER) reported for first-quarter 2006 its highest quarterly net revenues ever, $8.0 billion, up 28% from the prior-year quarter and 17% from the 2005 fourth quarter. Net revenues increased both sequentially and year-over-year in all three business segments and all global regions. These positive results were reflected in the stock's value, which has equaled the January 2001 high of about $80 (Figure 1). In contrast, in 2003, Merrill Lynch printed a low of $28.21, so this was an excellent turnaround performance in fewer than four years. The up move was composed of a first upleg (October 2002-February 2004), a one-year consolidation phase until October 2005, and a second leg of the uptrend, which is still ongoing. This last move saw seven consecutive months on an uptrend, but the series was interrupted by a negative April. The moving average convergence/divergence (MACD) has finished the acceleration phase. Note that it is lower than the value printed at the end of 2000. The MACD calculates two exponential moving averages (EMAs); the difference between these two averages is plotted as the MACD (blue line). This value is averaged and then plotted as the MACDAvg (red line). The difference between MACD and MACD average is plotted as the MACDDiff (red histogram). MACDiff is printing a negative divergence in this time frame. |

|
| FIGURE 1: MERRILL LYNCH, MONTHLY. The stock has reached the 2001 high. |
| Graphic provided by: TradeStation. |
| |
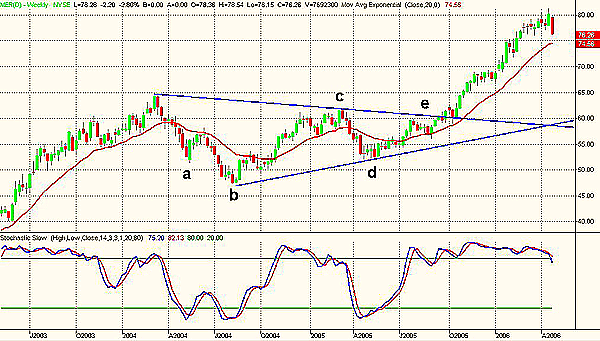
| The weekly chart (Figure 2) displays the symmetrical triangle developed in about 18 months. It is a typical continuation pattern that has been resolved with a breakout to the upside and the last fast uptrend. The slow stochastic helped spot the entry points during the formation (points B and D). The signal provided at point A occurred too early. A divergence was developed at point C. The breakout (point E) initiated a quick move that brought prices from $60 to $80 in six months. Last week, a long black candle was printed and the oscillator left the overbought area. It is too early to say in this time frame whether the uptrend is over. |

|
| FIGURE 2: MERRILL LYNCH, WEEKLY. The symmetrical triangle, a continuation pattern, has projected prices higher about 30% in six months. |
| Graphic provided by: TradeStation. |
| |
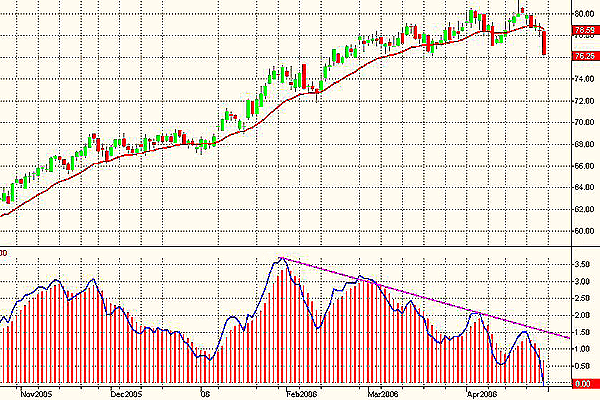
| At the daily level (Figure 3), you can see that the stock has developed multiple negative divergences of the 5-34-5 MACD since February 2006. Now it is entering the negative territory after the last trading sessions. In this case, three divergences have been developed before the trend reversed. Hard life for bears! |

|
| FIGURE 3: MERRILL LYNCH, DAILY. Multiple divergences of the MACD 5-3-4-5 have finally pushed prices lower during the last trading sessions. |
| Graphic provided by: TradeStation. |
| |
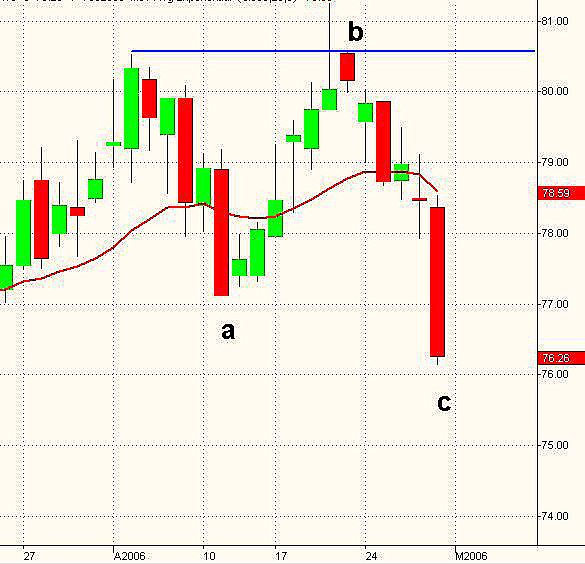
| The last trading sessions have been quite interesting. In Figure 4, you can see that at point A, the stock printed a long black candle that indicated lower prices ahead. Instead, Merrill Lynch turned up to reach new highs and trap the last bulls at point B. The reversal has been, as usual, fast, and the last bar, a trend day, has assigned the victory of this battle to bears. At this stage and in this time frame, we should expect lower prices and the continuation of the down move in the short term. But the trend in the longer time frame is still strong. As a consequence, I would not expect the end of the long-term uptrend, but a correction. I would monitor this phase, although it is not possible to know in advance how long and how deep it will be to spot a low-risk entry point. First supports can be identified at $73.50 and $72. Only when prices go above the high of the trend day bar at $78.54 can we assume a resumption of the uptrend. |

|
| FIGURE 4: MERRILL LYNCH, DAILY. A failed test of the resistance caused the acceleration of prices to the downside looking for new supports. |
| Graphic provided by: TradeStation. |
| |
Author of the book "Trading the US Markets - A Comprehensive Guide to US Markets for International Traders and Investors" - Harriman House (July 2008)
| Address: | VIA ROBERTO AGO 26 POSTAL CODE 00166 |
| Rome, ITALY | |
| Phone # for sales: | +393357540708 |
| E-mail address: | pezzutti.paolo@tiscali.it |
Click here for more information about our publications!
Comments
Date: 05/02/06Rank: 4Comment:

Request Information From Our Sponsors
- StockCharts.com, Inc.
- Candle Patterns
- Candlestick Charting Explained
- Intermarket Technical Analysis
- John Murphy on Chart Analysis
- John Murphy's Chart Pattern Recognition
- John Murphy's Market Message
- MurphyExplainsMarketAnalysis-Intermarket Analysis
- MurphyExplainsMarketAnalysis-Visual Analysis
- StockCharts.com
- Technical Analysis of the Financial Markets
- The Visual Investor
- VectorVest, Inc.
- Executive Premier Workshop
- One-Day Options Course
- OptionsPro
- Retirement Income Workshop
- Sure-Fire Trading Systems (VectorVest, Inc.)
- Trading as a Business Workshop
- VectorVest 7 EOD
- VectorVest 7 RealTime/IntraDay
- VectorVest AutoTester
- VectorVest Educational Services
- VectorVest OnLine
- VectorVest Options Analyzer
- VectorVest ProGraphics v6.0
- VectorVest ProTrader 7
- VectorVest RealTime Derby Tool
- VectorVest Simulator
- VectorVest Variator
- VectorVest Watchdog
