HOT TOPICS LIST
- MACD
- Fibonacci
- RSI
- Gann
- ADXR
- Stochastics
- Volume
- Triangles
- Futures
- Cycles
- Volatility
- ZIGZAG
- MESA
- Retracement
- Aroon
INDICATORS LIST
LIST OF TOPICS
PRINT THIS ARTICLE
by Paolo Pezzutti
Here's a basic chart pattern that provides good insight about consolidation phases within trends.
Position: N/A
Paolo Pezzutti
Author of the book "Trading the US Markets - A Comprehensive Guide to US Markets for International Traders and Investors" - Harriman House (July 2008)
PRINT THIS ARTICLE
FLAGS AND PENNANTS
Continuation Pattern: The Flag
04/28/06 10:35:26 AMby Paolo Pezzutti
Here's a basic chart pattern that provides good insight about consolidation phases within trends.
Position: N/A
| Flags and pennants are quite common. Normally, in technical analysis books they are discussed together because they are similar in appearance and tend to appear in the same place within trends. They also present the same volume distribution characteristics and objective measuring criteria. These formations represent a pause in strong trends, where price moves are originated by fast impulses. After a steep advance or decline on heavy volume, the market pauses before resuming the movement in the same direction. As the consolidation move develops, the volume declines dramatically, resuming the breakout in the direction of the trend. These are very reliable formations, caused by profit-taking after the first leg of the move. Typically, prices do not correct very much, as strong hands continue to accumulate during the consolidation. Usually, they last less than three weeks. The flag is characterized by price action contained within two parallel trendlines that slope against the prevailing trend, although it is not unusual for flags to appear horizontal (as short rectangles) or slope in the direction of the trend. Normally, it appears near the midpoint of a move with a failure rate, according to author Thomas Bulkowski, of about 12%-13%. The pennant, which is identified by two converging trendlines, is horizontal and very similar to a symmetrical triangle. Both the flags and the pennants, after the breakout that signals the trend resumption, have a price objective measured as the same length of the first leg of the move. |

|
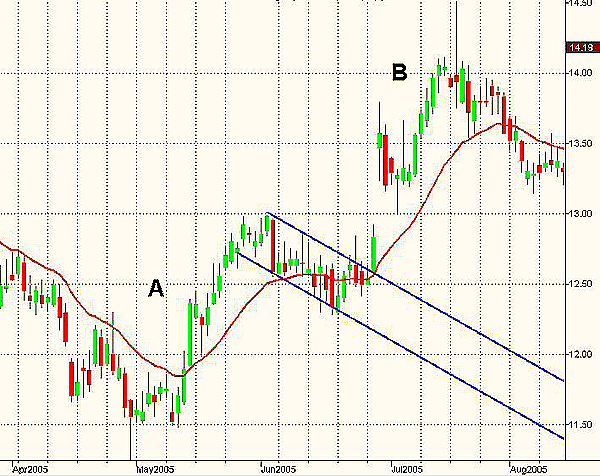
| FIGURE 1: ORCL, DAILY. A flag develops in the middle of an up move. The breakout to the upside is fast. |
| Graphic provided by: TradeStation. |
| |
| In Figure 1, you can see the daily chart of Oracle (ORCL). After a first leg of an uptrend characterized by high directionality, the stock takes a breather and develops a flag that lasts for a couple of weeks. Profit-taking by fast gainers is not enough to push prices significantly down, as there is accumulation on the stock. The breakout occurs with a gap and a quick move to the upside. Note that legs A and B have about the same length. |

|
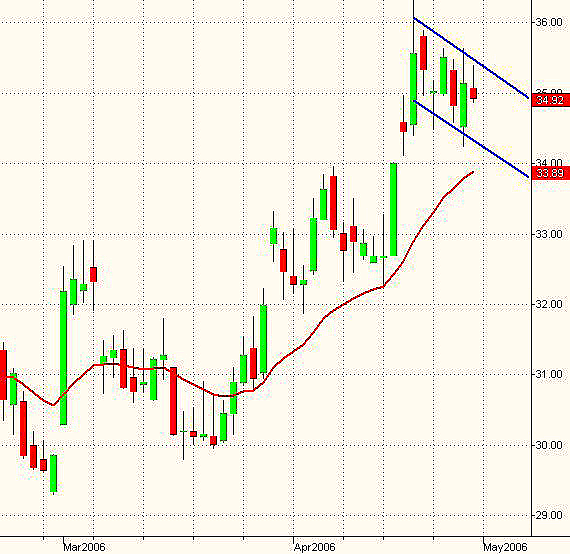
| FIGURE 2: TXN, DAILY. The stock is developing a flag. |
| Graphic provided by: TradeStation. |
| |
| Figure 2 displays a Texas Instruments (TXN) daily chart. The stock may be developing a bullish flag. Confirmation will occur at the breakout of the upper trendline. There is also the option to buy on support to anticipate the move. |

|
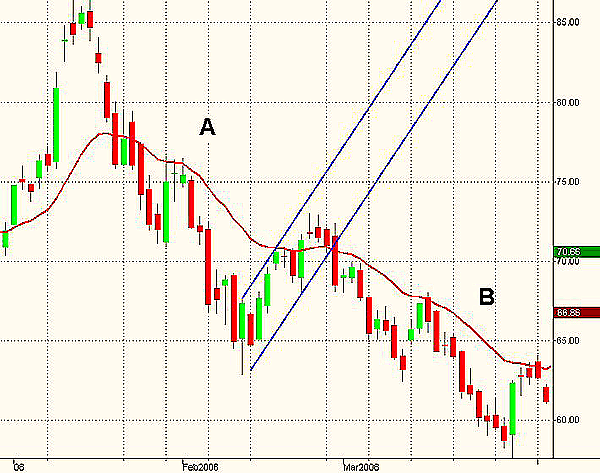
| FIGURE 3: AAPL, DAILY. The stock during the directional downtrend at the beginning of 2006 has printed a flag in the middle of the move. |
| Graphic provided by: TradeStation. |
| |
| In addition, Apple Computer (AAPL) in Figure 3 has recently developed a flag during the fast downtrend that has brought prices down from $85 to $60 in three months. Note that typically the exit from the channel is characterized by a dramatic increase in speed and volatility. The move must be fast and directional. The stop-loss must be implemented with discipline. In this case, I would place it above the high of the down breakout bar of February 28 at $72.40. |

|
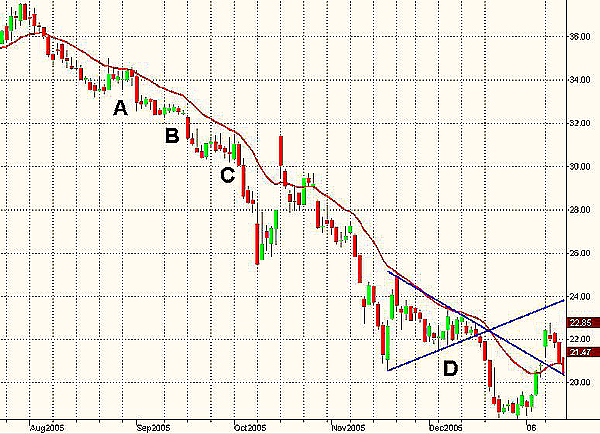
| FIGURE 4: GM, DAILY. General Motors has printed several continuation patterns during the long downtrend. |
| Graphic provided by: TradeStation. |
| |
| During the fast downtrend of General Motors (GM) from July to December 2005 (Figure 4), the stock alternated accelerations and paused throughout the period. At points A, B, and C, you can see the flags that, in some cases, did not have the strength to develop the typical contratrend slope. In fact, the flags at points B and C looked more horizontal. At point D, a pennant lasting a couple of weeks developed toward the end of the intermediate-term move. These basic charting patterns have validity. They are tools that can be useful in understanding the market phase and identifying good risk-reward trades, provided that the profit objective of the formation is of interest. |
Author of the book "Trading the US Markets - A Comprehensive Guide to US Markets for International Traders and Investors" - Harriman House (July 2008)
| Address: | VIA ROBERTO AGO 26 POSTAL CODE 00166 |
| Rome, ITALY | |
| Phone # for sales: | +393357540708 |
| E-mail address: | pezzutti.paolo@tiscali.it |
Click here for more information about our publications!
Comments
Date: 05/02/06Rank: 4Comment:
Date: 05/04/06Rank: 5Comment:

Request Information From Our Sponsors
- StockCharts.com, Inc.
- Candle Patterns
- Candlestick Charting Explained
- Intermarket Technical Analysis
- John Murphy on Chart Analysis
- John Murphy's Chart Pattern Recognition
- John Murphy's Market Message
- MurphyExplainsMarketAnalysis-Intermarket Analysis
- MurphyExplainsMarketAnalysis-Visual Analysis
- StockCharts.com
- Technical Analysis of the Financial Markets
- The Visual Investor
- VectorVest, Inc.
- Executive Premier Workshop
- One-Day Options Course
- OptionsPro
- Retirement Income Workshop
- Sure-Fire Trading Systems (VectorVest, Inc.)
- Trading as a Business Workshop
- VectorVest 7 EOD
- VectorVest 7 RealTime/IntraDay
- VectorVest AutoTester
- VectorVest Educational Services
- VectorVest OnLine
- VectorVest Options Analyzer
- VectorVest ProGraphics v6.0
- VectorVest ProTrader 7
- VectorVest RealTime Derby Tool
- VectorVest Simulator
- VectorVest Variator
- VectorVest Watchdog
