HOT TOPICS LIST
- MACD
- Fibonacci
- RSI
- Gann
- ADXR
- Stochastics
- Volume
- Triangles
- Futures
- Cycles
- Volatility
- ZIGZAG
- MESA
- Retracement
- Aroon
INDICATORS LIST
LIST OF TOPICS
PRINT THIS ARTICLE
by Gary Grosschadl
Traders who tried to get on this slow train early most likely were sorely disappointed, but now there's hope as the stock finally leaves the station.
Position: Buy
Gary Grosschadl
Independent Canadian equities trader and technical analyst based in Peterborough
Ontario, Canada.
PRINT THIS ARTICLE
REVERSAL
Intel's Train Whistle Finally Blows
04/28/06 08:57:28 AMby Gary Grosschadl
Traders who tried to get on this slow train early most likely were sorely disappointed, but now there's hope as the stock finally leaves the station.
Position: Buy
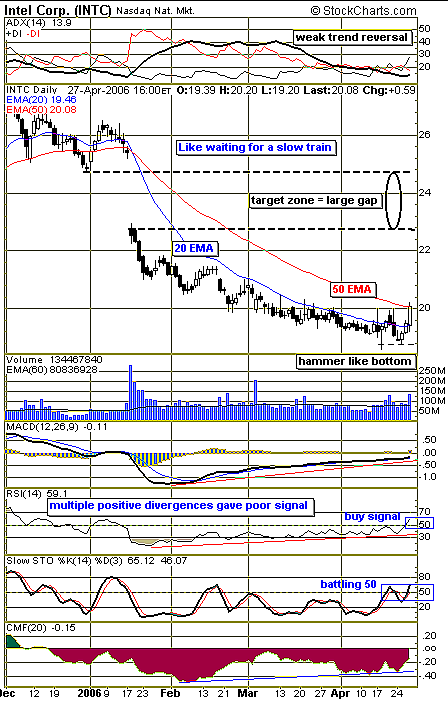
| It's been a dour three months for Intel (INTC) since it gapped down from above $25 to hit a possible bottom below $19. Figure 1 shows several anemic attempts to bounce that went nowhere unless you were a lucky and/or skillful daytrader. |
| Of the indicators/moving averages I normally watch, only two whispered "no deal" to keep the would-be trader from hitting the "deal" button. Those two indicators have kept me out of many a poor trade over the years. One challenge that technical traders face is always weighing the evidence before making the buy or sell decision. I am leery of buying a beat-up stock that trades under its 20-day exponential moving average (EMA) on a daily chart. This chart serves as a good example. Despite the multiple positive divergences one of my favorite indicators was showing, both the 20-day EMA and the relative strength index (RSI) told me to hold off. |

|
| FIGURE 1: INTEL, DAILY. This chart suggests a reversal pattern may be starting. |
| Graphic provided by: StockCharts.com. |
| |
| Stocks that fall below their 20-period moving averages can stay in a bear or sideways trend for an extended time; likewise, when the RSI fails to rise above its key 50 level. Divergences can give premature buy signals but do serve a purpose in that they often give traders a heads-up alert that the stock is due to pop at some point. Then it's just a matter of determining what buy trigger you act on, depending on how aggressive a trader you are and what time frame you are comfortable trading with. |
| Several other aspects to consider are the hammerlike candlestick marking a bottom that held support five trading days later, a weak trend reversal signal from the topmost graph (components of the directional movement indicator), stochastics oscillator reversing at its 50 level, and a more timely positive divergence signal from the Chaikin money flow (CMF) indicator. Note the target suggested on the chart is the gap zone 22.40–24.80. This may take more than the current upleg to reach. |
| Has INTC finally turned around? Quite possibly. Keep your eye on this train as it starts to pick up speed. |
Independent Canadian equities trader and technical analyst based in Peterborough
Ontario, Canada.
| Website: | www.whatsonsale.ca/financial.html |
| E-mail address: | gwg7@sympatico.ca |
Click here for more information about our publications!
Comments
Date: 04/29/06Rank: 5Comment:
Date: 05/07/06Rank: 2Comment:

Request Information From Our Sponsors
- StockCharts.com, Inc.
- Candle Patterns
- Candlestick Charting Explained
- Intermarket Technical Analysis
- John Murphy on Chart Analysis
- John Murphy's Chart Pattern Recognition
- John Murphy's Market Message
- MurphyExplainsMarketAnalysis-Intermarket Analysis
- MurphyExplainsMarketAnalysis-Visual Analysis
- StockCharts.com
- Technical Analysis of the Financial Markets
- The Visual Investor
- VectorVest, Inc.
- Executive Premier Workshop
- One-Day Options Course
- OptionsPro
- Retirement Income Workshop
- Sure-Fire Trading Systems (VectorVest, Inc.)
- Trading as a Business Workshop
- VectorVest 7 EOD
- VectorVest 7 RealTime/IntraDay
- VectorVest AutoTester
- VectorVest Educational Services
- VectorVest OnLine
- VectorVest Options Analyzer
- VectorVest ProGraphics v6.0
- VectorVest ProTrader 7
- VectorVest RealTime Derby Tool
- VectorVest Simulator
- VectorVest Variator
- VectorVest Watchdog
