HOT TOPICS LIST
- MACD
- Fibonacci
- RSI
- Gann
- ADXR
- Stochastics
- Volume
- Triangles
- Futures
- Cycles
- Volatility
- ZIGZAG
- MESA
- Retracement
- Aroon
INDICATORS LIST
LIST OF TOPICS
PRINT THIS ARTICLE
by David Penn
Breakaway gaps mark July corn's more than four-month-long rally.
Position: N/A
David Penn
Technical Writer for Technical Analysis of STOCKS & COMMODITIES magazine, Working-Money.com, and Traders.com Advantage.
PRINT THIS ARTICLE
GAPS
Corn Closes The Gap
04/28/06 09:51:20 AMby David Penn
Breakaway gaps mark July corn's more than four-month-long rally.
Position: N/A
Writing about breakaway gaps in the second edition of his book Encyclopedia Of Chart Patterns, Thomas Bulkowski notes:Breakaway gaps highlight the start of a new trend. Volume rises substantially above the prior day and price gaps upward and continues rising (or falling in the case of a descending price gap) forming new highs (or lows). |

|
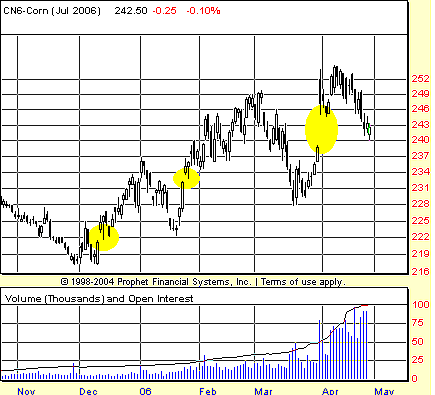
| FIGURE 1: JULY CORN FUTURES, DAILY. Highlighted in yellow are the three breakaway gaps that have characterized the ascent of July corn over the past few months. While some gaps were eventually closed (for example, the late January 2006 gap), others (for example, the early December 2005 gap) never were. In all cases, however, the end result was higher corn prices. |
| Graphic provided by: Prophet Financial, Inc. |
| |
As is the nature of futures contracts — particularly those with more than a few months before expiration — "common" or area gaps abound in the price chart shown in Figure 1. Common or area gaps have relatively little interpretive value and often simply represent a temporary supply/demand imbalance that forces prices to open higher or lower than they might have in a market more liquid or more frequently traded. As Robert Edwards and John Magee wrote in their book, Technical Analysis Of Stock Trends, on the subject of common or area gaps:This type of gap gets its name from its tendency to occur within a trading area or price congestion pattern ... Such pattern gaps are usually closed within a few days, and for obvious reasons, before the congestion formation in which they appeared is completed and prices break away from it. But not always. Sometimes a gap will develop in the last traverse of prices across the pattern area just before a breakout, and in such cases, it is not closed for a long time, nor is there any reason why it should be. |
| Truly, the far more interesting gaps are the breakaway variety. And what is especially noteworthy about the breakaway gaps shown in the chart of July corn futures (CN6) in Figure 1 is how they appear within days of a pivot low and lead to higher prices after the initial gap up on increased volume. These are all key features of breakaway gaps: that they (a) signify the beginning of a new trend, (b) lead immediately to higher prices, and (c) occur on an increase in volume. Looking at the chart in Figure 1, we see an initial breakaway gap in early December 2005 that occurs after a pivot low. CN6 gaps up from about $2.20 to a next session close of $2.25. Over the next few weeks, July corn rallies to $2.37 before peaking out in earliest January 2006. And although it is somewhat difficult to read on the chart provided, there was an increase in volume as July corn gapped up in December. |

|
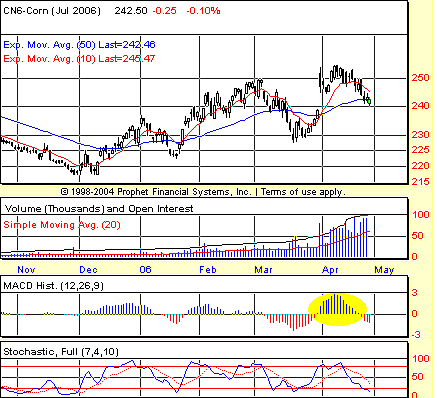
| FIGURE 2: JULY CORN FUTURES, DAILY. The strongly positive MACD histogram in April after July corn gapped up in late March suggests that the highs of April are likely to be exceeded once corn's current correction runs its course. |
| Graphic provided by: Prophet Financial, Inc. |
| |
| The other two breakaway gaps provided similarly robust upsides. The breakaway gap in late January 2006 saw CN6 close at $2.32, then gap up in the next session to open at $2.34 (closed at $2.35). Over the next few weeks, CN6 rallied to a closing high of $2.49 before making any significant correction. And the breakaway gap in late March saw July corn jump from a close of about $2.38 to an open of $2.52 (Figure 2). This last breakaway gap is interesting insofar as corn prices have retraced almost the entire post–breakaway gap move. After hitting a closing high of a little more than $2.54 in early April, July corn slipped back to $2.40 over the balance of the month. As of this writing, CN6 is extremely close to filling that breakaway gap from late March. |
| What are the odds that July corn will continue higher? Conventional wisdom suggests that the gap area will provide support to the current correction in corn. Recent history points to a 50/50 chance: the breakaway gap in December was a source of support once the corn market began declining in January. On the other hand, the breakaway gap in late January did not provide support for the corn correction in March, which exceeded the breakaway level by four or five cents. The best indication that corn prices will move higher comes from the strongly positive moving average convergence/divergence (MACD) histogram in early April. This histogram reflects the sort of bullishness that suggests that the price highs that occurred with the histogram peak will likely be exceeded by the next rally. Combining this with corn's pattern of higher lows since January makes for a fairly bullish outlook for July corn. |
Technical Writer for Technical Analysis of STOCKS & COMMODITIES magazine, Working-Money.com, and Traders.com Advantage.
| Title: | Technical Writer |
| Company: | Technical Analysis, Inc. |
| Address: | 4757 California Avenue SW |
| Seattle, WA 98116 | |
| Phone # for sales: | 206 938 0570 |
| Fax: | 206 938 1307 |
| Website: | www.Traders.com |
| E-mail address: | DPenn@traders.com |
Traders' Resource Links | |
| Charting the Stock Market: The Wyckoff Method -- Books | |
| Working-Money.com -- Online Trading Services | |
| Traders.com Advantage -- Online Trading Services | |
| Technical Analysis of Stocks & Commodities -- Publications and Newsletters | |
| Working Money, at Working-Money.com -- Publications and Newsletters | |
| Traders.com Advantage -- Publications and Newsletters | |
| Professional Traders Starter Kit -- Software | |
Click here for more information about our publications!
Comments
Date: 04/29/06Rank: 2Comment:

Request Information From Our Sponsors
- StockCharts.com, Inc.
- Candle Patterns
- Candlestick Charting Explained
- Intermarket Technical Analysis
- John Murphy on Chart Analysis
- John Murphy's Chart Pattern Recognition
- John Murphy's Market Message
- MurphyExplainsMarketAnalysis-Intermarket Analysis
- MurphyExplainsMarketAnalysis-Visual Analysis
- StockCharts.com
- Technical Analysis of the Financial Markets
- The Visual Investor
- VectorVest, Inc.
- Executive Premier Workshop
- One-Day Options Course
- OptionsPro
- Retirement Income Workshop
- Sure-Fire Trading Systems (VectorVest, Inc.)
- Trading as a Business Workshop
- VectorVest 7 EOD
- VectorVest 7 RealTime/IntraDay
- VectorVest AutoTester
- VectorVest Educational Services
- VectorVest OnLine
- VectorVest Options Analyzer
- VectorVest ProGraphics v6.0
- VectorVest ProTrader 7
- VectorVest RealTime Derby Tool
- VectorVest Simulator
- VectorVest Variator
- VectorVest Watchdog
