HOT TOPICS LIST
- MACD
- Fibonacci
- RSI
- Gann
- ADXR
- Stochastics
- Volume
- Triangles
- Futures
- Cycles
- Volatility
- ZIGZAG
- MESA
- Retracement
- Aroon
INDICATORS LIST
LIST OF TOPICS
PRINT THIS ARTICLE
by Gary Grosschadl
Now under the pressure of two key moving averages, LBTYA looks vulnerable to further downside.
Position: Hold
Gary Grosschadl
Independent Canadian equities trader and technical analyst based in Peterborough
Ontario, Canada.
PRINT THIS ARTICLE
CHANNEL LINES
Liberty Global Faces Key Resistance
04/28/06 10:14:59 AMby Gary Grosschadl
Now under the pressure of two key moving averages, LBTYA looks vulnerable to further downside.
Position: Hold
| Liberty Global is one of the largest cable television operators outside the United States, principally in Europe, Asia, and Latin America. |
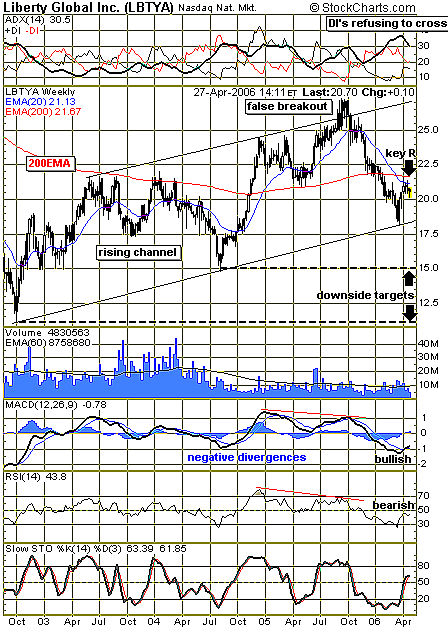
| The weekly chart shown in Figure 1 shows a bullish rising channel, but two key moving averages (the 20- and 200-period exponential) paint a bleaker picture. When stocks come off a peak and then fall below their 20-period moving average (MA), I consider the possibility that a failure pattern may develop. This is a downleg characterized by a series of bear rallies failing at the 20-period MA. Do not trust the stock until it closes above this overhead resistance. |

|
| FIGURE 1: LIBERTY, WEEKLY. This chart hints that the bullish channel will have a downside test soon. |
| Graphic provided by: StockCharts.com. |
| |
| What makes this more ominous is the fact that the stock is also under its key 200-period exponential moving average (EMA). Looking back on this chart, there is a history of multiple bounces off this line, leading me to conclude that once this line is violated, a change in trend may be under way. |
| We can also consider several indicators. At the top of the chart, we can see an overheated average directional movement index (ADX) line coming off a peak, which normally hints at a coming trend change. However, the directional movement indicators (DIs) have refused to cross after converging. This apparent failure to confirm the intended trend change (from bearish to bullish) hints at a renewal of bearish power. Below the chart, the MACD (moving average convergence/divergence) and the RSI (relative strength index) are not yet in agreement. The MACD shows a bullish cross of its signal line while the RSI is considered bearish, as it cannot rise above the key 50 level. They will eventually agree once the stock makes a more decisive move. |
| If LBTYA cannot close above its 200-day EMA, then at the very least, we can expect another test of the lower trendline, currently at $18.50. Should this fail, then two lower targets -- $15 and $11 -- come into play. |
Independent Canadian equities trader and technical analyst based in Peterborough
Ontario, Canada.
| Website: | www.whatsonsale.ca/financial.html |
| E-mail address: | gwg7@sympatico.ca |
Click here for more information about our publications!
PRINT THIS ARTICLE

Request Information From Our Sponsors
- StockCharts.com, Inc.
- Candle Patterns
- Candlestick Charting Explained
- Intermarket Technical Analysis
- John Murphy on Chart Analysis
- John Murphy's Chart Pattern Recognition
- John Murphy's Market Message
- MurphyExplainsMarketAnalysis-Intermarket Analysis
- MurphyExplainsMarketAnalysis-Visual Analysis
- StockCharts.com
- Technical Analysis of the Financial Markets
- The Visual Investor
- VectorVest, Inc.
- Executive Premier Workshop
- One-Day Options Course
- OptionsPro
- Retirement Income Workshop
- Sure-Fire Trading Systems (VectorVest, Inc.)
- Trading as a Business Workshop
- VectorVest 7 EOD
- VectorVest 7 RealTime/IntraDay
- VectorVest AutoTester
- VectorVest Educational Services
- VectorVest OnLine
- VectorVest Options Analyzer
- VectorVest ProGraphics v6.0
- VectorVest ProTrader 7
- VectorVest RealTime Derby Tool
- VectorVest Simulator
- VectorVest Variator
- VectorVest Watchdog
