HOT TOPICS LIST
- MACD
- Fibonacci
- RSI
- Gann
- ADXR
- Stochastics
- Volume
- Triangles
- Futures
- Cycles
- Volatility
- ZIGZAG
- MESA
- Retracement
- Aroon
INDICATORS LIST
LIST OF TOPICS
PRINT THIS ARTICLE
by Koos van der Merwe
Taking a cue from US President George Bush's recent speech on energy conservation, here is another company to watch.
Position: Accumulate
Koos van der Merwe
Has been a technical analyst since 1969, and has worked as a futures and options trader with First Financial Futures in Johannesburg, South Africa.
PRINT THIS ARTICLE
HEAD & SHOULDERS
Hydrogenics Corp. And Clean Energy
04/26/06 02:07:04 PMby Koos van der Merwe
Taking a cue from US President George Bush's recent speech on energy conservation, here is another company to watch.
Position: Accumulate
| Hydrogenics Corp. (HYGS) was founded in 1995 and is based in Mississauga, Canada. Its principal business is the development of clean energy solutions by commercializing hydrogen and fuel cell products, just what President Bush is looking for. |
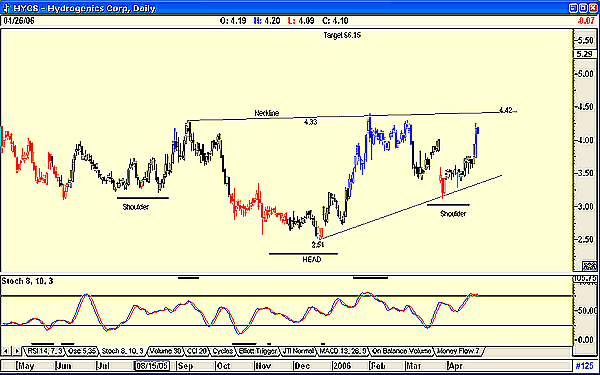
| The daily chart (Figure 1) suggests that a possible head & shoulders pattern is developing. A move above the neckline at $4.42 should see a rise to the target of $6.15 (4.33 - 2.51 = 1.82 + 4.33 = 6.15). The negativity in the chart stems from the stochastic indicator, which is overbought and suggests that a sell could be in the offing. |

|
| FIGURE 1: HYDROGENICS, DAILY. A head & shoulders pattern appears to be developing for this stock. |
| Graphic provided by: AdvancedGET. |
| |
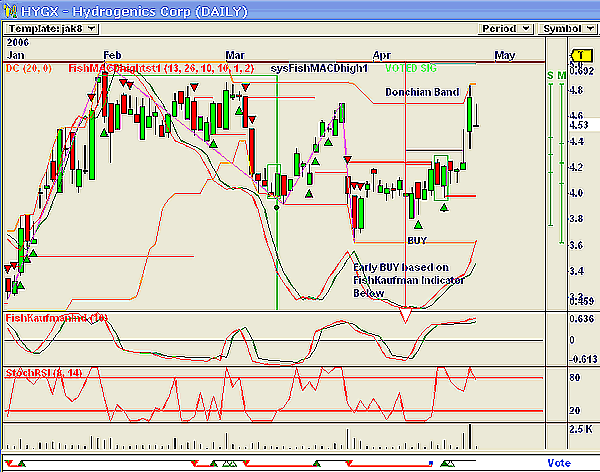
| My second chart is the same stock but this time using the Omnitrader optimizing program (Figure 2). The chart suggested a buy signal based on the strategy I used, on Wednesday, April 19, at $3.96. I have also shown an earlier buy signal on a falling market based on the FishKaufman indicator. The Kaufman indicator is a standard trend indicator, and the FishKaufman indicator is one I developed to smooth the Kaufman indicator, and it appears to work well. |

|
| FIGURE 2: HYDROGENICS, DAILY. Here's a daily buy signal shown here using the Omnitrader optimizing program |
| Graphic provided by: Omnitrader. |
| |
| To conclude, the Figure 1 AdvancedGET daily chart is suggesting a head & shoulders pattern possibility. The Omnitrader chart is confirming a buy signal, and although the price is touching the upper band of the Donchian trading channel, a sell signal has not been given. The 8,14 period stochRSI is suggesting that there may be weakness in the near future, something that could be taken advantage of. This is a stock to watch, and to consider buying on any pullback. Conservative investors could wait for a move above the neckline. |
Has been a technical analyst since 1969, and has worked as a futures and options trader with First Financial Futures in Johannesburg, South Africa.
| Address: | 3256 West 24th Ave |
| Vancouver, BC | |
| Phone # for sales: | 6042634214 |
| E-mail address: | petroosp@gmail.com |
Click here for more information about our publications!
Comments
Date: 04/29/06Rank: 4Comment:
Date: 05/11/06Rank: 5Comment:

Request Information From Our Sponsors
- StockCharts.com, Inc.
- Candle Patterns
- Candlestick Charting Explained
- Intermarket Technical Analysis
- John Murphy on Chart Analysis
- John Murphy's Chart Pattern Recognition
- John Murphy's Market Message
- MurphyExplainsMarketAnalysis-Intermarket Analysis
- MurphyExplainsMarketAnalysis-Visual Analysis
- StockCharts.com
- Technical Analysis of the Financial Markets
- The Visual Investor
- VectorVest, Inc.
- Executive Premier Workshop
- One-Day Options Course
- OptionsPro
- Retirement Income Workshop
- Sure-Fire Trading Systems (VectorVest, Inc.)
- Trading as a Business Workshop
- VectorVest 7 EOD
- VectorVest 7 RealTime/IntraDay
- VectorVest AutoTester
- VectorVest Educational Services
- VectorVest OnLine
- VectorVest Options Analyzer
- VectorVest ProGraphics v6.0
- VectorVest ProTrader 7
- VectorVest RealTime Derby Tool
- VectorVest Simulator
- VectorVest Variator
- VectorVest Watchdog
