HOT TOPICS LIST
- MACD
- Fibonacci
- RSI
- Gann
- ADXR
- Stochastics
- Volume
- Triangles
- Futures
- Cycles
- Volatility
- ZIGZAG
- MESA
- Retracement
- Aroon
INDICATORS LIST
LIST OF TOPICS
PRINT THIS ARTICLE
by David Penn
The year-to-date consolidation in sugar futures could be hinting at more historic highs to come.
Position: N/A
David Penn
Technical Writer for Technical Analysis of STOCKS & COMMODITIES magazine, Working-Money.com, and Traders.com Advantage.
PRINT THIS ARTICLE
CUP WITH HANDLE
Cup (Of Sugar) With Handle
04/25/06 09:47:16 AMby David Penn
The year-to-date consolidation in sugar futures could be hinting at more historic highs to come.
Position: N/A
| The last time I took a look at sugar futures was three months ago back in late January. At the time, I was pointing out how the conventional wisdom on sugar's incredible rally in the second half of 2005 was based, in part, on the role that sugar plays in the energy game. We all know that sugar provides quite a bit of energy to young children, but rumors that Brazil was making a major move toward ethanol -- a potential substitute for gasoline -- convinced sugar traders that the demand for sugar was going higher. |

|
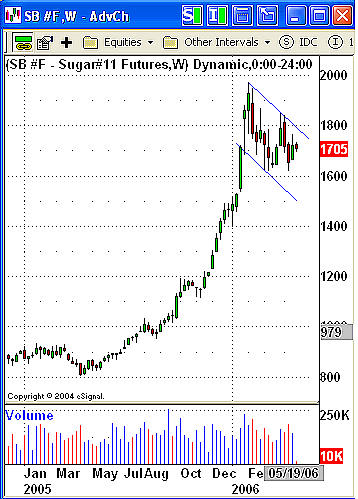
| FIGURE 1: CONTINUOUS SUGAR FUTURES, WEEKLY. This sort of "wedging down" after an extended move is characteristic of a flag (in this case, a bullish flag) that often marks strong profit-taking — and almost equally strong bargain-hunting from those who have been sitting out the trend and now see lower prices as an opportunity to bid. |
| Graphic provided by: eSignal. |
| |
| If you want to put sugar's contemporary moves in context, then go check out Figure 1 of my 2005 article "Sweet Divergences" (Traders.com Advantage, June 7, 2005). That figure shows a long-term of chart of sugar prices going back to 1993. The chart shows a decline beginning in 1998 that saw sugar prices more than cut in half by early 1999. From 1998 through 2005, sugar traced out a consolidation with the sort of lower highs and higher lows that virtually spells t-r-i-a-n-g-l-e. As I wrote at the time, "This contracting triangle, which has been developing since the late 1990s, suggests the possibility of a strong secular move in sugar prices." |
| And that is precisely what has happened in the nine months since that article was published. Trading around nine cents in the summer of 2005, sugar (basis continuous futures) soared to an amazing 19 cents a pound by January 2006, reaching levels not seen in sugar since the spring of 1981. |

|
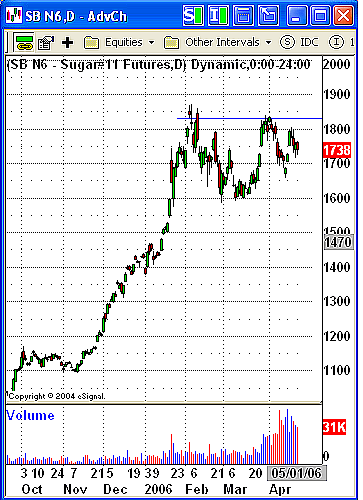
| FIGURE 2: JULY 2006 SUGAR FUTURES, DAILY. This rough-hewn cup with handle is still a work in progress as bulls struggle to keep sugar prices above the low created in mid-April. A move and close above 18.5 cents would likely represent a breakout and a minimum two-cent move higher. |
| Graphic provided by: eSignal. |
| |
| Since those January 2006 highs, sugar prices have moderated somewhat: declining in what appears to be a bull flag type of pattern in the weekly charts (Figure 1), but tracing out what increasingly appears to be a cup with handle pattern in the daily charts (Figure 2). There is no contradiction in this. In fact, it is possible that the cup with handle in the daily charts is confirming the bull flag in the weekly charts. Both formations developed over the bulk of 2006, both represent areas of consolidation after trends (up from the spring 2005 lows in the case of the weekly chart, up from the autumn 2005 lows in the case of the daily chart), and most important, both are bullish indications for sugar. |
| The proof is will be in the breakout. And if the patterns I'm hinting at turn out to be valid, there will be plenty of proof to go around. Looking first at the potential cup with handle pattern in the daily chart, we can see that a formation low at 16 cents (basis July futures) and a formation high of about 18.25 cents point to an initial minimum upside of 20.5 cents on a successful breakout. The potential for the weekly bull flag is particularly eye-popping and notable. Upside projections for flags involve taking the measure of the move before the flag and adding that amount to the value at the bottom of the flag, insofar as the long-term chart in Figure 1 shows the origins of the move into the bull flag as occurring in the early spring of 2005 from about 8 cents. The top of the bull flag is about 19.75 cents. Adding the difference of 11.75 to the value at the bottom of the flag (approximately 16 cents) gives a minimum upside of 27.75 cents, should sugar successfully break out to the upside from the bull flag in the weekly charts. As high as these sugar prices would be, they would still fall short of both the all-time high in 1974 and the "K-2" of sugar peaks in 1980. |
Technical Writer for Technical Analysis of STOCKS & COMMODITIES magazine, Working-Money.com, and Traders.com Advantage.
| Title: | Technical Writer |
| Company: | Technical Analysis, Inc. |
| Address: | 4757 California Avenue SW |
| Seattle, WA 98116 | |
| Phone # for sales: | 206 938 0570 |
| Fax: | 206 938 1307 |
| Website: | www.Traders.com |
| E-mail address: | DPenn@traders.com |
Traders' Resource Links | |
| Charting the Stock Market: The Wyckoff Method -- Books | |
| Working-Money.com -- Online Trading Services | |
| Traders.com Advantage -- Online Trading Services | |
| Technical Analysis of Stocks & Commodities -- Publications and Newsletters | |
| Working Money, at Working-Money.com -- Publications and Newsletters | |
| Traders.com Advantage -- Publications and Newsletters | |
| Professional Traders Starter Kit -- Software | |
Click here for more information about our publications!
Comments
Date: 04/29/06Rank: 3Comment:

Request Information From Our Sponsors
- StockCharts.com, Inc.
- Candle Patterns
- Candlestick Charting Explained
- Intermarket Technical Analysis
- John Murphy on Chart Analysis
- John Murphy's Chart Pattern Recognition
- John Murphy's Market Message
- MurphyExplainsMarketAnalysis-Intermarket Analysis
- MurphyExplainsMarketAnalysis-Visual Analysis
- StockCharts.com
- Technical Analysis of the Financial Markets
- The Visual Investor
- VectorVest, Inc.
- Executive Premier Workshop
- One-Day Options Course
- OptionsPro
- Retirement Income Workshop
- Sure-Fire Trading Systems (VectorVest, Inc.)
- Trading as a Business Workshop
- VectorVest 7 EOD
- VectorVest 7 RealTime/IntraDay
- VectorVest AutoTester
- VectorVest Educational Services
- VectorVest OnLine
- VectorVest Options Analyzer
- VectorVest ProGraphics v6.0
- VectorVest ProTrader 7
- VectorVest RealTime Derby Tool
- VectorVest Simulator
- VectorVest Variator
- VectorVest Watchdog
