HOT TOPICS LIST
- MACD
- Fibonacci
- RSI
- Gann
- ADXR
- Stochastics
- Volume
- Triangles
- Futures
- Cycles
- Volatility
- ZIGZAG
- MESA
- Retracement
- Aroon
INDICATORS LIST
LIST OF TOPICS
PRINT THIS ARTICLE
by David Penn
Signs point to a significant bottom in March, which suggests near-term corrections may be excellent opportunities to the long side.
Position: N/A
David Penn
Technical Writer for Technical Analysis of STOCKS & COMMODITIES magazine, Working-Money.com, and Traders.com Advantage.
PRINT THIS ARTICLE
BREAKOUTS
Good Times For Gold?
04/25/06 07:54:23 AMby David Penn
Signs point to a significant bottom in March, which suggests near-term corrections may be excellent opportunities to the long side.
Position: N/A
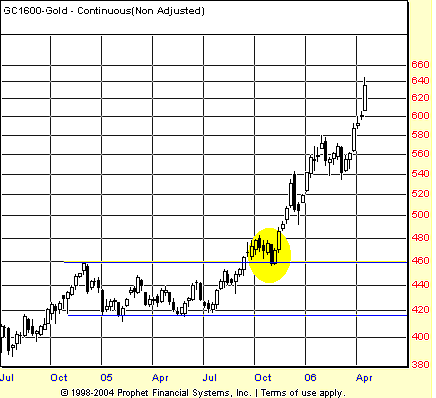
| The last time gold prices made a significant low was back in the autumn of 2005 (Figure 1). That might surprise a few people, because there was no major correction in gold at the time. Nevertheless, there are at least two kinds of significant lows. The more common (or, more commonly thought of) significant low comes after a significant correction. Think of the stock market crash of 1987 as an example of the kind of selloff that leads to a classic, tradable low. Or, more recently, consider the autumn of 2004, which served as a significant low in advance of the resumption of the 2002–present cyclical bull market. |

|
| FIGURE 1: CONTINUOUS GOLD FUTURES, WEEKLY. Gold broke free from a sideways/rectangular consolidation late in the third quarter of 2005. A month-long pullback to the breakout level provided an excellent opportunity for gold buyers to accumulate at lower prices before the advance continued. |
| Graphic provided by: Prophet Financial, Inc. |
| |
| The other kind of significant low comes not as a result of a correction but often as a result of a breakout. This kind of low is often a test of resistance-turned-support, which is where the significance of such lows comes from. I have referred to such breakouts as "don't look back" (DLB) breakouts (see my article "Building A Better Breakout," Working-Money.com, July 1, 2003, or, more recently, my article "The Oil Service HOLDRS DLB Breakout," Traders.com Advantage, January 10, 2006). By this, I am referring to breakouts that move beyond a consolidation range, test the top of that range for support (or, in a declining market, test the bottom of that range for resistance), and then resume moving beyond the consolidation range. Such breaks are often signs of true strength and conviction and often lead to profitable trends for traders to exploit. |
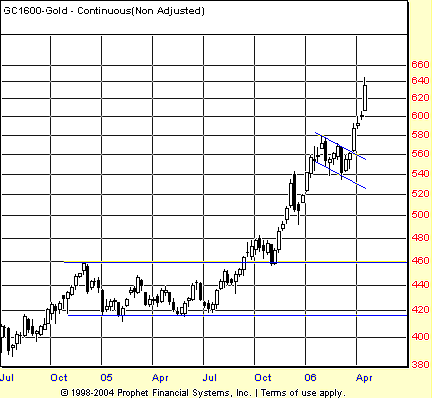
| Since the fourth-quarter 2005 low, gold appears to have made another significant low in the first quarter of 2006. That low came early in March (see my article "The Gold Bug Bounce," Traders.com Advantage, March 29, 2006). In fact, looking at first-quarter 2006 on the weekly chart (Figure 2), it is clear that the first quarter on the weekly chart was a sort of bull flag from which gold broke free to the upside in the last week of the first quarter. Bull flags, as we are reminded by Thomas Bulkowski in the second edition of his Encyclopedia Of Chart Patterns, tend to be consolidations in trends worth spotting, often signaling a very strong market that is unable (or, rather, that is loaded with traders who are unwilling) to sell off for any sustained period. |

|
| FIGURE 2: CONTINUOUS GOLD FUTURES, WEEKLY. The first quarter of 2006 took the form of a bull flag in this weekly chart. Although gold prices are already near vertical, the appearance of a bull flag suggests that more upside is still possible — if not likely. |
| Graphic provided by: Prophet Financial, Inc. |
| |
| If the first quarter of 2006 was a bull flag consolidation, then the potential for significantly higher price gold remains a very real one — even with gold futures topping the $640 level on an intraweek basis. The measurement rule for bull flags involves taking the measure of the move leading up to the flag and adding that amount to the value at the lowest point of the flag formation. In the case of gold (basis continuous futures), this would mean adding 160 points (580 less 420) to the value at the bottom of the flag (540) for an upside minimum of $700. Given the intensity of gold's move so far, it is easy to see how typical "round number attraction" could mesmerize traders into believing that $700 gold simply makes sense. At least in this context, the technical picture provides some support for such gut feelings. |
| How does this analysis at the weekly level square with the charts on a daily level? There are a couple of technical features on the daily charts of gold that merit mention. After the bottom in March (the "Gold Bug Bounce" article discusses that event in technical detail), the next most significant technical event is likely the sizable moving average convergence/divergence (MACD) histogram that developed on gold's bounce in late March. Confirmed bottoms that are followed by sizable MACD histograms are often a strong indicator of higher prices (a point I first read in Alexander Elder's excellent book Trading For A Living). Traders have certainly seen this happen since the histogram peaked in earliest April — right before gold went on to break through the $600 level. It should be pointed out that more often than not, sizable histograms like this are often followed by a significant correction in price — a correction that paves the way for a renewed advance. The fact that gold (basis June) appears to be developing negative divergences in both the stochastic and the MACD histogram here in late April underscores the possibility of a pullback. But traders who keep that pullback in perspective are likely to find themselves rewarded for their patience a few months down the road. |
Technical Writer for Technical Analysis of STOCKS & COMMODITIES magazine, Working-Money.com, and Traders.com Advantage.
| Title: | Technical Writer |
| Company: | Technical Analysis, Inc. |
| Address: | 4757 California Avenue SW |
| Seattle, WA 98116 | |
| Phone # for sales: | 206 938 0570 |
| Fax: | 206 938 1307 |
| Website: | www.Traders.com |
| E-mail address: | DPenn@traders.com |
Traders' Resource Links | |
| Charting the Stock Market: The Wyckoff Method -- Books | |
| Working-Money.com -- Online Trading Services | |
| Traders.com Advantage -- Online Trading Services | |
| Technical Analysis of Stocks & Commodities -- Publications and Newsletters | |
| Working Money, at Working-Money.com -- Publications and Newsletters | |
| Traders.com Advantage -- Publications and Newsletters | |
| Professional Traders Starter Kit -- Software | |
Click here for more information about our publications!
Comments
Date: 04/26/06Rank: 5Comment:
Date: 04/29/06Rank: 4Comment:

Request Information From Our Sponsors
- StockCharts.com, Inc.
- Candle Patterns
- Candlestick Charting Explained
- Intermarket Technical Analysis
- John Murphy on Chart Analysis
- John Murphy's Chart Pattern Recognition
- John Murphy's Market Message
- MurphyExplainsMarketAnalysis-Intermarket Analysis
- MurphyExplainsMarketAnalysis-Visual Analysis
- StockCharts.com
- Technical Analysis of the Financial Markets
- The Visual Investor
- VectorVest, Inc.
- Executive Premier Workshop
- One-Day Options Course
- OptionsPro
- Retirement Income Workshop
- Sure-Fire Trading Systems (VectorVest, Inc.)
- Trading as a Business Workshop
- VectorVest 7 EOD
- VectorVest 7 RealTime/IntraDay
- VectorVest AutoTester
- VectorVest Educational Services
- VectorVest OnLine
- VectorVest Options Analyzer
- VectorVest ProGraphics v6.0
- VectorVest ProTrader 7
- VectorVest RealTime Derby Tool
- VectorVest Simulator
- VectorVest Variator
- VectorVest Watchdog
