HOT TOPICS LIST
- MACD
- Fibonacci
- RSI
- Gann
- ADXR
- Stochastics
- Volume
- Triangles
- Futures
- Cycles
- Volatility
- ZIGZAG
- MESA
- Retracement
- Aroon
INDICATORS LIST
LIST OF TOPICS
PRINT THIS ARTICLE
by Paolo Pezzutti
The stock is consolidating and in the intermediate term, a bullish head & shoulder formation is developing.
Position: N/A
Paolo Pezzutti
Author of the book "Trading the US Markets - A Comprehensive Guide to US Markets for International Traders and Investors" - Harriman House (July 2008)
PRINT THIS ARTICLE
TECHNICAL ANALYSIS
Fannie Mae Consolidates Near Short-Term Support
04/25/06 12:13:02 PMby Paolo Pezzutti
The stock is consolidating and in the intermediate term, a bullish head & shoulder formation is developing.
Position: N/A
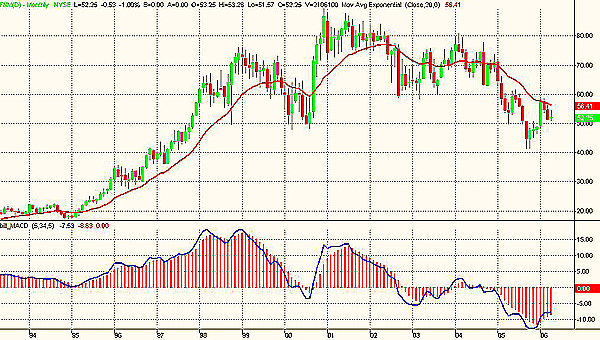
| The Federal National Mortgage Association (better known as Fannie Mae) has an interesting technical situation with a performance that has been unsatisfactory over the past five years (Figure 1). Prices reached the $89 level at the end of 2000, and now, Fannie Mae's value is only about $52. In the long term, the $50 level is important and, for the moment, the stock has managed to move above this level again. In this time frame, the resistance of $60 is important for the stock to remain within the trading range of the past few years. |

|
| FIGURE 1: FNM, MONTHLY. In this time frame, the chart shows that the stock has provided an unsatisfactory performance to investors during the past few years. |
| Graphic provided by: TradeStation. |
| |
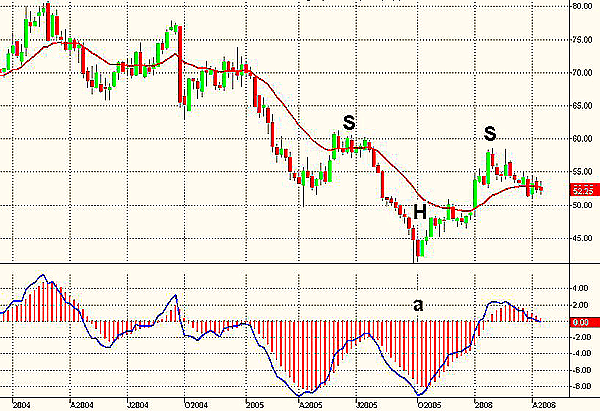
| In the intermediate time frame (Figure 2), during the past two years, the stock has been moving in a steep downtrend. From the $80 level it reached in 2004, Fannie Mae printed a low of $41.34 last September. The technical situation presented the low with a positive divergence of the moving average convergence/divergence (MACD) (point a), which provided the strength to move again toward the $60 resistance. Most important, the stock is developing a bullish head & shoulder formation, with the price objective of $80. Prices are now consolidating after having formed the right shoulder. Of course, this phase is critical to see if the formation is confirmed with the breakout of the neckline level of $60. A failure of the formation would bring prices dramatically lower. |

|
| FIGURE 2: FNM, WEEKLY. The stock is developing a bullish head & shoulder formation. Prices have formed the right shoulder. This phase is critical to see if FNM has enough strength to move up and test the neckline of the formation. |
| Graphic provided by: TradeStation. |
| |
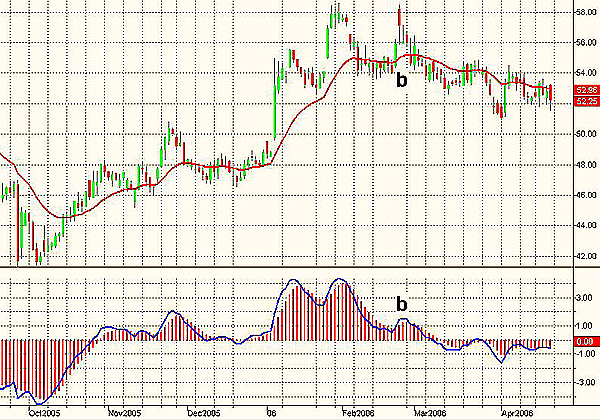
| At the daily level (Figure 3), the situation is more complex. The double top printed at $58 last February with a significant negative divergence of MACD has initiated a correction that is still ongoing. To be sure, news about interest rates for the foreseeable future have not helped the stock lately. |

|
| FIGURE 3: FNM, DAILY. After a double top, prices have been moving to the downside. |
| Graphic provided by: TradeStation. |
| |
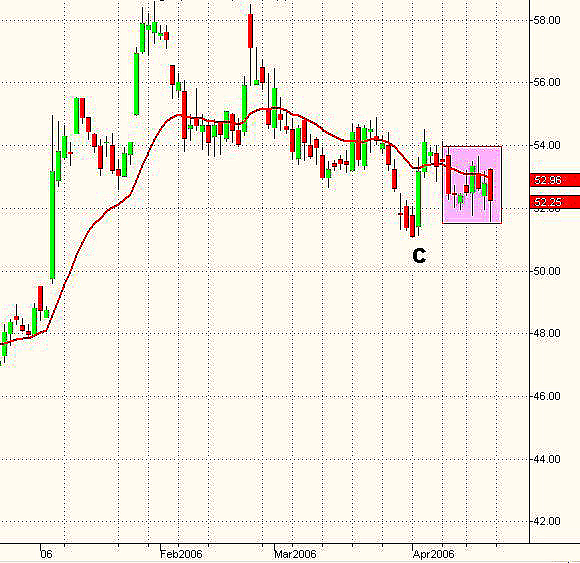
| After the April 4th long white candle (point c), prices have started a consolidation phase. The support represented by the low of this candlestick is now very important for a leg of an uptrend to be initiated. |

|
| FIGURE 4: FNM, DAILY. A long white candle followed by a long consolidation presents a good risk-reward situation in the event that prices manage to move above the $54-$55 area. |
| Graphic provided by: TradeStation. |
| |
| By contrast, the daily level offers a less promising trading environment. The $50-$51 area could provide a support to the downside. To the upside, the $54-$55 area provides a significant resistance. It is likely that the stock requires an additional accumulation period before attempting to retest the critical level of $58-$60, which also represents the neckline of the head & shoulder formation. Opening a position at these levels might have advantages from the risk-reward perspective, should a positive scenario materialize in the coming weeks. True, the outcome of a long trade is less certain, but that is part of the game. The more information you have, the less return you can expect from your investment. It is a tradeoff that depends on your trading style. Risk and return are correlated, but returns cannot be controlled. The only thing that you can measure and control is, in fact, risk — that is, finding trading situations that maximize the risk-reward ratio. |
Author of the book "Trading the US Markets - A Comprehensive Guide to US Markets for International Traders and Investors" - Harriman House (July 2008)
| Address: | VIA ROBERTO AGO 26 POSTAL CODE 00166 |
| Rome, ITALY | |
| Phone # for sales: | +393357540708 |
| E-mail address: | pezzutti.paolo@tiscali.it |
Click here for more information about our publications!
Comments
Date: 04/29/06Rank: 3Comment:

Request Information From Our Sponsors
- StockCharts.com, Inc.
- Candle Patterns
- Candlestick Charting Explained
- Intermarket Technical Analysis
- John Murphy on Chart Analysis
- John Murphy's Chart Pattern Recognition
- John Murphy's Market Message
- MurphyExplainsMarketAnalysis-Intermarket Analysis
- MurphyExplainsMarketAnalysis-Visual Analysis
- StockCharts.com
- Technical Analysis of the Financial Markets
- The Visual Investor
- VectorVest, Inc.
- Executive Premier Workshop
- One-Day Options Course
- OptionsPro
- Retirement Income Workshop
- Sure-Fire Trading Systems (VectorVest, Inc.)
- Trading as a Business Workshop
- VectorVest 7 EOD
- VectorVest 7 RealTime/IntraDay
- VectorVest AutoTester
- VectorVest Educational Services
- VectorVest OnLine
- VectorVest Options Analyzer
- VectorVest ProGraphics v6.0
- VectorVest ProTrader 7
- VectorVest RealTime Derby Tool
- VectorVest Simulator
- VectorVest Variator
- VectorVest Watchdog
