HOT TOPICS LIST
- MACD
- Fibonacci
- RSI
- Gann
- ADXR
- Stochastics
- Volume
- Triangles
- Futures
- Cycles
- Volatility
- ZIGZAG
- MESA
- Retracement
- Aroon
INDICATORS LIST
LIST OF TOPICS
PRINT THIS ARTICLE
by Arthur Hill
BMC Software shows signs of accumulation, and a consolidation breakout looks increasingly likely.
Position: N/A
Arthur Hill
Arthur Hill is currently editor of TDTrader.com, a website specializing in trading strategies, sector/industry specific breadth stats and overall technical analysis. He passed the Society of Technical Analysts (STA London) diploma exam with distinction is a Certified Financial Technician (CFTe). Prior to TD Trader, he was the Chief Technical Analyst for Stockcharts.com and the main contributor to the ChartSchool.
PRINT THIS ARTICLE
VOLUME
BMC Bounces On Good Volume
04/24/06 10:06:00 AMby Arthur Hill
BMC Software shows signs of accumulation, and a consolidation breakout looks increasingly likely.
Position: N/A
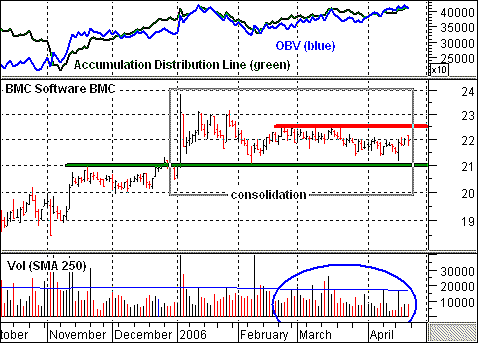
| On the price chart, BMC Software (BMC) surged with the broader market from mid-October until early January and then consolidated the last three months (gray box) (Figure 1). Prices have traded between 21 and 23 since February and the range is quite tight. A break above 22.5 resistance would be bullish and a break below 21 support would be bearish. |

|
| FIGURE 1: BMC SOFTWARE. BMC surged with the broader market from mid-October until early January and then consolidated the last three months (gray box). |
| Graphic provided by: MetaStock. |
| |
| For clues on the direction of the next break, I am turning to on-balance volume (OBV) and the accumulation- distribution line. Both indicators use volume to gauge buying pressure and selling pressure. The security has been trading flat, but both indicators are rising and hit new highs recently. This shows that buying pressure has been strong within the consolidation. A look at actual volume confirms this buying pressure. Note that the up days (black volume bars) are consistently higher than the down volume days (red volume bars). This is what the bulls want to see: more money moving in on advances and less money moving out on declines. |
| Volume indicators point to an upside breakout and the prior move was up. The advance from mid-October until early January sets the bullish tone and the subsequent consolidation is viewed as a rest after this advance. Stocks don't always go straight up and a period of consolidation is often required to digest gains. As long as support at 21 holds, I would expect a continuation breakout at 22.5 and a move to the upper 20s. |
Arthur Hill is currently editor of TDTrader.com, a website specializing in trading strategies, sector/industry specific breadth stats and overall technical analysis. He passed the Society of Technical Analysts (STA London) diploma exam with distinction is a Certified Financial Technician (CFTe). Prior to TD Trader, he was the Chief Technical Analyst for Stockcharts.com and the main contributor to the ChartSchool.
| Title: | Editor |
| Company: | TDTrader.com |
| Address: | Willem Geetsstraat 17 |
| Mechelen, B2800 | |
| Phone # for sales: | 3215345465 |
| Website: | www.tdtrader.com |
| E-mail address: | arthurh@tdtrader.com |
Traders' Resource Links | |
| TDTrader.com has not added any product or service information to TRADERS' RESOURCE. | |
Click here for more information about our publications!
Comments
Date: 04/29/06Rank: 4Comment:

Request Information From Our Sponsors
- StockCharts.com, Inc.
- Candle Patterns
- Candlestick Charting Explained
- Intermarket Technical Analysis
- John Murphy on Chart Analysis
- John Murphy's Chart Pattern Recognition
- John Murphy's Market Message
- MurphyExplainsMarketAnalysis-Intermarket Analysis
- MurphyExplainsMarketAnalysis-Visual Analysis
- StockCharts.com
- Technical Analysis of the Financial Markets
- The Visual Investor
- VectorVest, Inc.
- Executive Premier Workshop
- One-Day Options Course
- OptionsPro
- Retirement Income Workshop
- Sure-Fire Trading Systems (VectorVest, Inc.)
- Trading as a Business Workshop
- VectorVest 7 EOD
- VectorVest 7 RealTime/IntraDay
- VectorVest AutoTester
- VectorVest Educational Services
- VectorVest OnLine
- VectorVest Options Analyzer
- VectorVest ProGraphics v6.0
- VectorVest ProTrader 7
- VectorVest RealTime Derby Tool
- VectorVest Simulator
- VectorVest Variator
- VectorVest Watchdog
