HOT TOPICS LIST
- MACD
- Fibonacci
- RSI
- Gann
- ADXR
- Stochastics
- Volume
- Triangles
- Futures
- Cycles
- Volatility
- ZIGZAG
- MESA
- Retracement
- Aroon
INDICATORS LIST
LIST OF TOPICS
PRINT THIS ARTICLE
by Koos van der Merwe
What's ahead for gold? Here are some facts to remember.
Position: Sell
Koos van der Merwe
Has been a technical analyst since 1969, and has worked as a futures and options trader with First Financial Futures in Johannesburg, South Africa.
PRINT THIS ARTICLE
ELLIOTT WAVE
Gold, Whither Goest Thou?
04/21/06 11:43:19 AMby Koos van der Merwe
What's ahead for gold? Here are some facts to remember.
Position: Sell
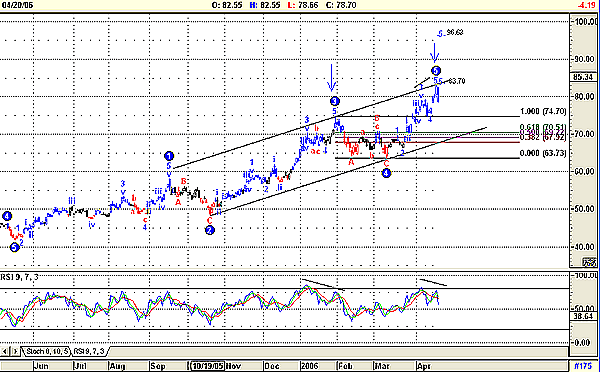
| I have always found it difficult to forecast the gold price using either COMEX gold or London gold. COMEX gold anticipates a price and is inclined to be volatile, whereas London gold fixes a price and is cast in stone. I find that I am inclined to look at the CBOE index, and more specifically, the Canadian i-Unit S&P/TSX Capped Gold Index Fund (XGD-T) for direction. The former is factual as an index, while the latter is the immediate culmination of the emotions of traders represented as an index-unit. Strictly speaking, Barclays created a product that represents the index, but it is highly tradable, and hence the emotional involvement of buyers and sellers in the price. Figure 1 is a daily chart of the i-unit. |

|
| FIGURE 1: S&P/TSX I-UNIT. The divergence sell signal is highlighted here, where the i-unit is making higher highs. |
| Graphic provided by: AdvancedGET. |
| |
| I have highlighted the divergence sell signal; that is where the i-unit is making higher highs, not reflected in the indicator that is making lower highs. The indicator I have used is a nine-day relative strength index (RSI), which is more volatile than the standard 14-day RSI. |
| I have also shown an Elliott wave count, as determined by the AdvancedGET program. The wave count suggests that the fifth wave could be complete (the "5" is blocked in blue), but it is also suggesting that there could be a higher high to 83.70 (a high of 83.03 was reached on April 19) with an outside target of 96.63. Should the index be completing a wave 5, it should then retrace to somewhere in the fourth wave of lesser degree — between the values of 63.73 and 74.20. I have drawn in Fibonacci levels suggesting possible retracement targets. The fall should be in an A-down, B-up and C-down, with the C-wave bottoming at any of the Fibonacci levels suggested. |
| I must admit, however, that I place greater importance on the divergence strategy, and I would suggest that profits are taken. We could also take a short position. With an i-unit, we do not have to wait for a higher price to go short, nor do we have to borrow stock, which makes shorting the i-unit a pleasure. Finally, remember that with the falling US dollar, US traders have a further advantage of a rising Canadian dollar. To conclude, the i-Unit S&P/TSX Capped Gold Index Fund (XGD-T) is suggesting that the gold price for the moment may have overshot the mark and is due for a correction. |
Has been a technical analyst since 1969, and has worked as a futures and options trader with First Financial Futures in Johannesburg, South Africa.
| Address: | 3256 West 24th Ave |
| Vancouver, BC | |
| Phone # for sales: | 6042634214 |
| E-mail address: | petroosp@gmail.com |
Click here for more information about our publications!
Comments
Date: 04/21/06Rank: 3Comment:
Date: 04/25/06Rank: 5Comment:

Request Information From Our Sponsors
- VectorVest, Inc.
- Executive Premier Workshop
- One-Day Options Course
- OptionsPro
- Retirement Income Workshop
- Sure-Fire Trading Systems (VectorVest, Inc.)
- Trading as a Business Workshop
- VectorVest 7 EOD
- VectorVest 7 RealTime/IntraDay
- VectorVest AutoTester
- VectorVest Educational Services
- VectorVest OnLine
- VectorVest Options Analyzer
- VectorVest ProGraphics v6.0
- VectorVest ProTrader 7
- VectorVest RealTime Derby Tool
- VectorVest Simulator
- VectorVest Variator
- VectorVest Watchdog
- StockCharts.com, Inc.
- Candle Patterns
- Candlestick Charting Explained
- Intermarket Technical Analysis
- John Murphy on Chart Analysis
- John Murphy's Chart Pattern Recognition
- John Murphy's Market Message
- MurphyExplainsMarketAnalysis-Intermarket Analysis
- MurphyExplainsMarketAnalysis-Visual Analysis
- StockCharts.com
- Technical Analysis of the Financial Markets
- The Visual Investor
