HOT TOPICS LIST
- MACD
- Fibonacci
- RSI
- Gann
- ADXR
- Stochastics
- Volume
- Triangles
- Futures
- Cycles
- Volatility
- ZIGZAG
- MESA
- Retracement
- Aroon
INDICATORS LIST
LIST OF TOPICS
PRINT THIS ARTICLE
by Arthur Hill
After a long consolidation, ExxonMobil broke triangle resistance to signal a continuation higher.
Position: Buy
Arthur Hill
Arthur Hill is currently editor of TDTrader.com, a website specializing in trading strategies, sector/industry specific breadth stats and overall technical analysis. He passed the Society of Technical Analysts (STA London) diploma exam with distinction is a Certified Financial Technician (CFTe). Prior to TD Trader, he was the Chief Technical Analyst for Stockcharts.com and the main contributor to the ChartSchool.
PRINT THIS ARTICLE
TRIANGLES
ExxonMobil Breaks Triangle Resistance
04/20/06 10:54:59 AMby Arthur Hill
After a long consolidation, ExxonMobil broke triangle resistance to signal a continuation higher.
Position: Buy
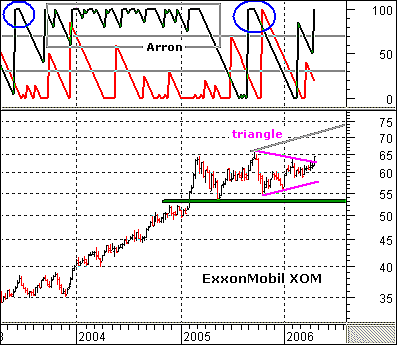
| ExxonMobil (XOM) was a top performer from late 2003 until early 2004 (Figure 1). After a big surge above 60 in February 2004, the stock started a long consolidation period. The move from 35 to 65 was huge, and the stock needed time to digest these gains. The digestion period came as a consolidation or a correction. For XOM, the digestion phase consisted of a large consolidation between 43 and 56. |

|
| FIGURE 1: EXXONMOBIL. After a sharp jump in price in 2004, XON began a long consolidation period. |
| Graphic provided by: MetaStock. |
| |
| Technically, a consolidation breakout would not occur until the index breaks the 2005 high. However, the right half of the consolidation evolved into a triangle and the stock broke above the upper trendline with a big move in mid-April. The breakout is bullish and the upside target is the mid-70s over the next few weeks and months. I found this target by extending a trendline (gray) that was parallel to the lower channel trendline. This trendline extends to 74 in August. |
| A breakout and move above 70 in the Aroon indicator confirms underlying strength. Aroon Up (green) surged above 70 in September 2005, but this surge failed to hold. The indicator is once again above 70 and this shows strength behind the current move. Aroon Up also failed to hold the first move above 70 in May 2003 (blue oval), but then managed to hold above 70 for over a year as the stock trended higher (gray box). As long as Aroon Up holds above 50, the current breakout is strong and I would expect higher prices. |
Arthur Hill is currently editor of TDTrader.com, a website specializing in trading strategies, sector/industry specific breadth stats and overall technical analysis. He passed the Society of Technical Analysts (STA London) diploma exam with distinction is a Certified Financial Technician (CFTe). Prior to TD Trader, he was the Chief Technical Analyst for Stockcharts.com and the main contributor to the ChartSchool.
| Title: | Editor |
| Company: | TDTrader.com |
| Address: | Willem Geetsstraat 17 |
| Mechelen, B2800 | |
| Phone # for sales: | 3215345465 |
| Website: | www.tdtrader.com |
| E-mail address: | arthurh@tdtrader.com |
Traders' Resource Links | |
| TDTrader.com has not added any product or service information to TRADERS' RESOURCE. | |
Click here for more information about our publications!
Comments
Date: 04/21/06Rank: 4Comment:

Request Information From Our Sponsors
- StockCharts.com, Inc.
- Candle Patterns
- Candlestick Charting Explained
- Intermarket Technical Analysis
- John Murphy on Chart Analysis
- John Murphy's Chart Pattern Recognition
- John Murphy's Market Message
- MurphyExplainsMarketAnalysis-Intermarket Analysis
- MurphyExplainsMarketAnalysis-Visual Analysis
- StockCharts.com
- Technical Analysis of the Financial Markets
- The Visual Investor
- VectorVest, Inc.
- Executive Premier Workshop
- One-Day Options Course
- OptionsPro
- Retirement Income Workshop
- Sure-Fire Trading Systems (VectorVest, Inc.)
- Trading as a Business Workshop
- VectorVest 7 EOD
- VectorVest 7 RealTime/IntraDay
- VectorVest AutoTester
- VectorVest Educational Services
- VectorVest OnLine
- VectorVest Options Analyzer
- VectorVest ProGraphics v6.0
- VectorVest ProTrader 7
- VectorVest RealTime Derby Tool
- VectorVest Simulator
- VectorVest Variator
- VectorVest Watchdog
