HOT TOPICS LIST
- MACD
- Fibonacci
- RSI
- Gann
- ADXR
- Stochastics
- Volume
- Triangles
- Futures
- Cycles
- Volatility
- ZIGZAG
- MESA
- Retracement
- Aroon
INDICATORS LIST
LIST OF TOPICS
PRINT THIS ARTICLE
by Paolo Pezzutti
The stock of the retailing giant has been moving in a trading range during the past year.
Position: N/A
Paolo Pezzutti
Author of the book "Trading the US Markets - A Comprehensive Guide to US Markets for International Traders and Investors" - Harriman House (July 2008)
PRINT THIS ARTICLE
TECHNICAL ANALYSIS
Wal-Mart Near Short-Term Support
04/19/06 08:05:11 AMby Paolo Pezzutti
The stock of the retailing giant has been moving in a trading range during the past year.
Position: N/A
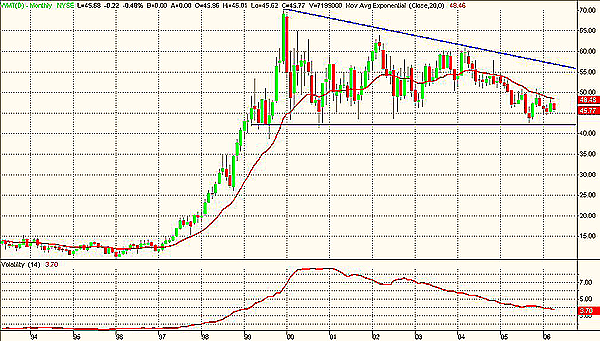
| In Figure 1, the monthly chart for Wal-Mart Stores (WMT), the stock is well below the 2000 top of $70. The retail sector has not provided an exciting performance to investors of late. WMT has been developing a bearish triangle during the past five years. In the chart, you can see that volatility, after the peak in 2000, has been decreasing during the formation development. The base of the triangle is near the $42.30 value. The upper trendline is running above the $55 level. This trading range is containing the price action, at least so far. |

|
| FIGURE 1: WAL-MART, MONTHLY. WMT is developing a triangle. Note how volatility is decreasing while prices move toward the apex. |
| Graphic provided by: TradeStation. |
| |
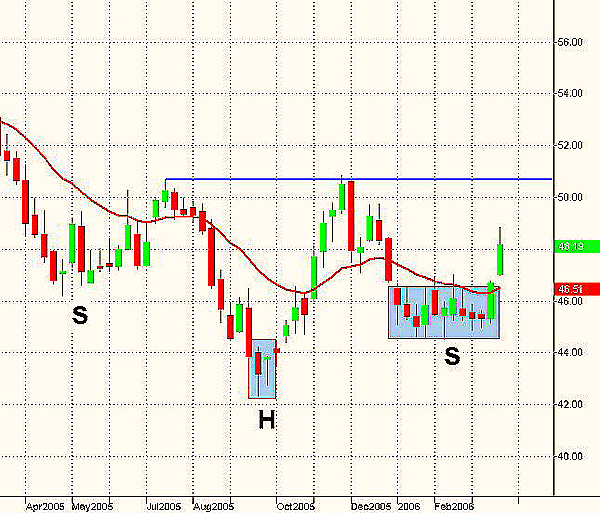
| At the weekly level, in Figure 2, Wal-Mart has been developing a bullish head & shoulders formation since 2005. This is one of the most famous chart patterns. In this case, the neckline is at the $50 level, and the right shoulder at about $45 is slightly lower than the left one at about $46. The head was printed on high volume at $42.30 in September 2005. The bullish objective of the formation would project prices at $58. The stock is now testing the right shoulder support. This is a critical phase to see if prices are able to move up and test the neckline resistance of $50. The upside potential is very interesting. Considering a failure of the formation, should prices break out to the downside to the low of $42, this would cause an acceleration of prices with an increase in volatility. It is up to your own unique trading style to decide the direction of the trade. You could, for example, try and anticipate the move to the upside to test at least the $50 value, or you could wait for the breakout to the upside of the trendline to be sure that an uptrend has been initiated. If you are bearish on the stock, a failure of the head & shoulder formation would probably provide a reliable signal that an intermediate downtrend has started. |

|
| FIGURE 2: WAL-MART, WEEKLY. A head & shoulder formation would be confirmed above the neckline above $50. |
| Graphic provided by: TradeStation. |
| |
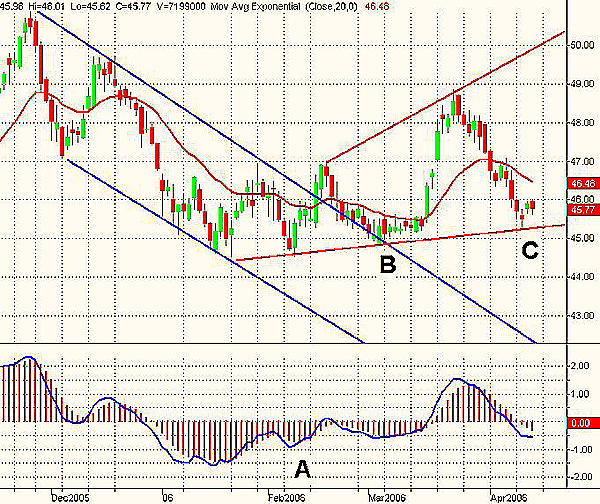
| Let's see if, at the daily level, we can gather some more information. At the monthly level, so far we have identified a bearish triangle, while in the weekly time frame we have a bullish head & shoulder. In Figure 3 you can see the daily chart of the stock. Since December 2005, the stock has engaged a downtrend within a decreasing channel. At point A, in February, prices printed a double low associated to a positive divergence of the moving average convergence/divergence (MACD). This was a good indication, and Wal-Mart managed to break out the upper trendline. Since then, the stock has been moving within a broadening formation. The lower trendline has been tested three times already (points B and C), and therefore it has great value as an indicator of the support's strength. Should a breakout of this trendline occur, prices would quickly move to the downside. The technical situation is not very positive. However, as the stock is near the support level, the risk management of a long trade is favorable from the risk-reward ratio perspective. In this time frame, you have a volatile nondirectional market condition, where oscillators should work well. |

|
| FIGURE 3: WAL-MART, DAILY. A broadening formation is being developed in WMT. |
| Graphic provided by: TradeStation. |
| |
Author of the book "Trading the US Markets - A Comprehensive Guide to US Markets for International Traders and Investors" - Harriman House (July 2008)
| Address: | VIA ROBERTO AGO 26 POSTAL CODE 00166 |
| Rome, ITALY | |
| Phone # for sales: | +393357540708 |
| E-mail address: | pezzutti.paolo@tiscali.it |
Click here for more information about our publications!
Comments
Date: 04/19/06Rank: 4Comment:

Request Information From Our Sponsors
- VectorVest, Inc.
- Executive Premier Workshop
- One-Day Options Course
- OptionsPro
- Retirement Income Workshop
- Sure-Fire Trading Systems (VectorVest, Inc.)
- Trading as a Business Workshop
- VectorVest 7 EOD
- VectorVest 7 RealTime/IntraDay
- VectorVest AutoTester
- VectorVest Educational Services
- VectorVest OnLine
- VectorVest Options Analyzer
- VectorVest ProGraphics v6.0
- VectorVest ProTrader 7
- VectorVest RealTime Derby Tool
- VectorVest Simulator
- VectorVest Variator
- VectorVest Watchdog
- StockCharts.com, Inc.
- Candle Patterns
- Candlestick Charting Explained
- Intermarket Technical Analysis
- John Murphy on Chart Analysis
- John Murphy's Chart Pattern Recognition
- John Murphy's Market Message
- MurphyExplainsMarketAnalysis-Intermarket Analysis
- MurphyExplainsMarketAnalysis-Visual Analysis
- StockCharts.com
- Technical Analysis of the Financial Markets
- The Visual Investor
