HOT TOPICS LIST
- MACD
- Fibonacci
- RSI
- Gann
- ADXR
- Stochastics
- Volume
- Triangles
- Futures
- Cycles
- Volatility
- ZIGZAG
- MESA
- Retracement
- Aroon
INDICATORS LIST
LIST OF TOPICS
PRINT THIS ARTICLE
by Arthur Hill
A gap and breakout on big volume point to higher prices for Flextronics.
Position: Buy
Arthur Hill
Arthur Hill is currently editor of TDTrader.com, a website specializing in trading strategies, sector/industry specific breadth stats and overall technical analysis. He passed the Society of Technical Analysts (STA London) diploma exam with distinction is a Certified Financial Technician (CFTe). Prior to TD Trader, he was the Chief Technical Analyst for Stockcharts.com and the main contributor to the ChartSchool.
PRINT THIS ARTICLE
ON BALANCE VOLUME
Flextronics Flexes Its Muscle
04/18/06 08:55:21 AMby Arthur Hill
A gap and breakout on big volume point to higher prices for Flextronics.
Position: Buy
| Technician Joe Granville developed the on-balance volume (OBV) indicator based on the assumption that volume leads prices. The idea was that a breakout in the OBV would be followed by a breakout in prices. The calculation is simply to add the volume on up days and subtracting the volume on down days. If volume on up days is higher than volume on down days, then the line should advance, and this shows buying strength. |

|
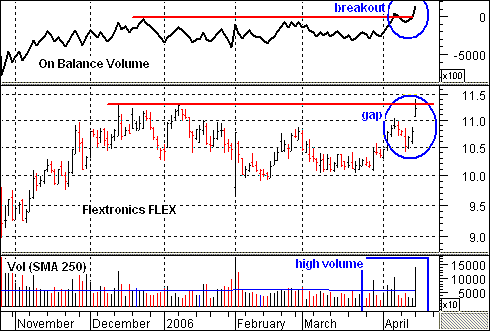
| FIGURE 1: FLEXTRONICS. The on-balance volume for FLEX shows that the stock had a higher higher in early April and a breakout in mid-April. |
| Graphic provided by: MetaStock. |
| |
| Looking at OBV for Flextronics (FLEX) (Figure 1), we can see a higher high in early April and a breakout in mid-April. Even though the stock remained below resistance in early April, the higher high in early April showed that buying pressure was strong. This strength is also confirmed by the volume bars at the bottom. The six highest volume days occurred when the stock advanced (blue box). There was clearly not much interest in selling but a whole lot of interest in buying. |
| The stock established support around 10 in February–March and broke resistance with a gap above 11 (blue oval). This gap formed on high volume and was confirmed by a breakout in OBV. The move solidifies support at 10 and points to higher prices. The summer highs are around 14, and my upside target would be based on this resistance area. As long as the gap holds, I would consider it a breakaway gap and firmly bullish. A move below the gap and below the mid-April low (10.4) would negate the breakout and put FLEX back in its trading range. |
Arthur Hill is currently editor of TDTrader.com, a website specializing in trading strategies, sector/industry specific breadth stats and overall technical analysis. He passed the Society of Technical Analysts (STA London) diploma exam with distinction is a Certified Financial Technician (CFTe). Prior to TD Trader, he was the Chief Technical Analyst for Stockcharts.com and the main contributor to the ChartSchool.
| Title: | Editor |
| Company: | TDTrader.com |
| Address: | Willem Geetsstraat 17 |
| Mechelen, B2800 | |
| Phone # for sales: | 3215345465 |
| Website: | www.tdtrader.com |
| E-mail address: | arthurh@tdtrader.com |
Traders' Resource Links | |
| TDTrader.com has not added any product or service information to TRADERS' RESOURCE. | |
Click here for more information about our publications!
Comments
Date: 04/18/06Rank: 4Comment:

Request Information From Our Sponsors
- StockCharts.com, Inc.
- Candle Patterns
- Candlestick Charting Explained
- Intermarket Technical Analysis
- John Murphy on Chart Analysis
- John Murphy's Chart Pattern Recognition
- John Murphy's Market Message
- MurphyExplainsMarketAnalysis-Intermarket Analysis
- MurphyExplainsMarketAnalysis-Visual Analysis
- StockCharts.com
- Technical Analysis of the Financial Markets
- The Visual Investor
- VectorVest, Inc.
- Executive Premier Workshop
- One-Day Options Course
- OptionsPro
- Retirement Income Workshop
- Sure-Fire Trading Systems (VectorVest, Inc.)
- Trading as a Business Workshop
- VectorVest 7 EOD
- VectorVest 7 RealTime/IntraDay
- VectorVest AutoTester
- VectorVest Educational Services
- VectorVest OnLine
- VectorVest Options Analyzer
- VectorVest ProGraphics v6.0
- VectorVest ProTrader 7
- VectorVest RealTime Derby Tool
- VectorVest Simulator
- VectorVest Variator
- VectorVest Watchdog
