HOT TOPICS LIST
- MACD
- Fibonacci
- RSI
- Gann
- ADXR
- Stochastics
- Volume
- Triangles
- Futures
- Cycles
- Volatility
- ZIGZAG
- MESA
- Retracement
- Aroon
INDICATORS LIST
LIST OF TOPICS
PRINT THIS ARTICLE
by David Penn
A two-month rally in retail stocks finds itself reversed in April.
Position: N/A
David Penn
Technical Writer for Technical Analysis of STOCKS & COMMODITIES magazine, Working-Money.com, and Traders.com Advantage.
PRINT THIS ARTICLE
REVERSAL
1-2-3 Trend Reversal In Retail
04/18/06 08:28:22 AMby David Penn
A two-month rally in retail stocks finds itself reversed in April.
Position: N/A
| It's hard to beat the retail stocks for a read on what investors think about consumer confidence going forward. Because of the large volume of transactions that takes place on credit in the retail business, retail stocks also do a good job of gauging the, well, greed of the capitalist consumer. Greed, after all, doesn't just make market prices go up. Greed — or less provocatively, demand — is what keeps the prices up in the stores and shops of retail America as well. And it is an absence of that greed that brings more panic to shopkeepers and storeowners than the idea of a year without Christmas. |

|
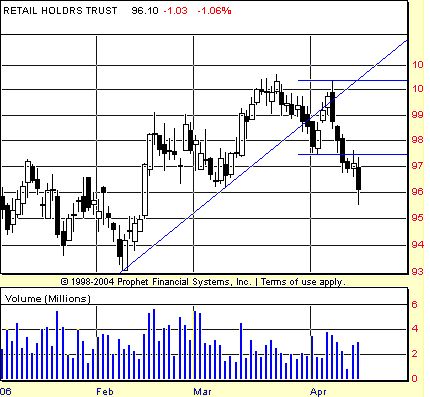
| FIGURE 1: RETAIL HOLDRS, DAILY. By mid-April, retail stocks as measured by the retail stock HOLDRS (RTH) have completed the third stage of the 1-2-3 trend reversal by closing beyond the price limit set by the initial trendline break in earliest April. |
| Graphic provided by: Prophet Financial, Inc. |
| |
| Currently, investors in retail stocks don't have a good outlook on where consumers will find themselves over the next few months. Blame it on the stagnant wages, blame it on oil prices, blame it on a consumer who has already been on a spending binge by many accounts and needs a break ... the fact is that retail stocks have entered the heart of spring with a classic 1-2-3 trend reversal, all of which has developed over the course of the first half of April (Figure 1). |
| The trendline that marked the uptrend just ended in retail stocks began in early February. It is an ideal trendline insofar as it connects the lowest lows in the period under consideration (2006) with the highest lows (in early March) immediately before the highest highs (in late March). This, by way of reminder, is how Victor Sperandeo, trader and author of Trader Vic: Methods Of A Wall Street Master, encourages technical traders to draw trendlines, and I've not come across a better, more consistent way of doing it. Because the 1-2-3 trendline reversal requires a well-constructed trendline, it makes sense to stick with Sperandeo's trendline-drawing recommendation. |

|
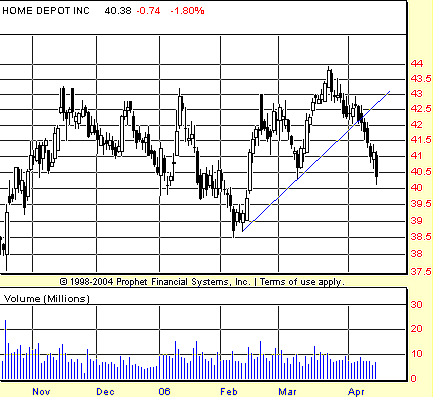
| FIGURE 2: HOME DEPOT, DAILY. Shares of Home Depot mirrored the fortunes of retail stocks as a whole (as measured by the retail HOLDRS) as they soared in February and March and crashed in April. |
| Graphic provided by: Prophet Financial, Inc. |
| |
| Stage 1 in the reversal occurred when prices broke down below the trendline in late March and more decisively in the first few days of April. The low set by this trendline break to the downside represents an important price limit that I'll refer to again shortly. Stage 2 in the reversal occurred a few days later, as RTH attempted to reestablish the February–March uptrend. This effort failed spectacularly on April 7, when a bearish engulfing candlestick signaled to all who were paying attention that the bounce from the 97.5 area was over (Figure 2). All that remained was stage 3. In stage 3, the market reverses again, this time in the direction of the trendline break and attempts to move beyond the price limit set during stage 1. That price limit was approximately 97.5, and two days after the bearish engulfing session, that price limit was breached on a closing basis. |
| A scan through the retail stock sector shows a number of equities that had been weak going into spring, as well as a number that remain strong in mid-April. But a great many retail stocks look a lot like RTH: a rally through March and a correction in April. It remains to be seen how much technical damage this reversal will ultimately cost both RTH and the stocks that make up the retail sector. But the measure of that damage will tell investors and speculators a great deal about the consumers whose appetite for consumption is what continues to keep the economy afloat. |
Technical Writer for Technical Analysis of STOCKS & COMMODITIES magazine, Working-Money.com, and Traders.com Advantage.
| Title: | Technical Writer |
| Company: | Technical Analysis, Inc. |
| Address: | 4757 California Avenue SW |
| Seattle, WA 98116 | |
| Phone # for sales: | 206 938 0570 |
| Fax: | 206 938 1307 |
| Website: | www.Traders.com |
| E-mail address: | DPenn@traders.com |
Traders' Resource Links | |
| Charting the Stock Market: The Wyckoff Method -- Books | |
| Working-Money.com -- Online Trading Services | |
| Traders.com Advantage -- Online Trading Services | |
| Technical Analysis of Stocks & Commodities -- Publications and Newsletters | |
| Working Money, at Working-Money.com -- Publications and Newsletters | |
| Traders.com Advantage -- Publications and Newsletters | |
| Professional Traders Starter Kit -- Software | |
Click here for more information about our publications!
Comments
Date: 04/18/06Rank: 3Comment:
Date: 04/19/06Rank: 3Comment:

Request Information From Our Sponsors
- VectorVest, Inc.
- Executive Premier Workshop
- One-Day Options Course
- OptionsPro
- Retirement Income Workshop
- Sure-Fire Trading Systems (VectorVest, Inc.)
- Trading as a Business Workshop
- VectorVest 7 EOD
- VectorVest 7 RealTime/IntraDay
- VectorVest AutoTester
- VectorVest Educational Services
- VectorVest OnLine
- VectorVest Options Analyzer
- VectorVest ProGraphics v6.0
- VectorVest ProTrader 7
- VectorVest RealTime Derby Tool
- VectorVest Simulator
- VectorVest Variator
- VectorVest Watchdog
- StockCharts.com, Inc.
- Candle Patterns
- Candlestick Charting Explained
- Intermarket Technical Analysis
- John Murphy on Chart Analysis
- John Murphy's Chart Pattern Recognition
- John Murphy's Market Message
- MurphyExplainsMarketAnalysis-Intermarket Analysis
- MurphyExplainsMarketAnalysis-Visual Analysis
- StockCharts.com
- Technical Analysis of the Financial Markets
- The Visual Investor
