

HOT TOPICS LIST
- MACD
- Fibonacci
- RSI
- Gann
- ADXR
- Stochastics
- Volume
- Triangles
- Futures
- Cycles
- Volatility
- ZIGZAG
- MESA
- Retracement
- Aroon
INDICATORS LIST
LIST OF TOPICS
PRINT THIS ARTICLE
by David Penn
Has the long, year-to-date nightmare in Internet stocks finally passed?
Position: N/A
David Penn
Technical Writer for Technical Analysis of STOCKS & COMMODITIES magazine, Working-Money.com, and Traders.com Advantage.
PRINT THIS ARTICLE
HEAD & SHOULDERS
A Head & Shoulders Bottom In Triple H?
04/18/06 08:11:32 AMby David Penn
Has the long, year-to-date nightmare in Internet stocks finally passed?
Position: N/A
| One of the first rules of spotting head & shoulders bottoms is that these patterns must occur at bottoms. Call it a truism if you will, and a "commanding grasp of the obvious" if you must, but in the rush to spot a particular chart pattern, technical traders often forget that the golden rule of real estate ("Location! Location! Location!") is no less true when it comes to chart patterns: A bottom that occurs after an intermediate-term moving average is broken is probably not one that will create meaningful, reversal-oriented chart patterns. If you want to find a bottom, then you've got to look down — and often, the further down the better. |
|
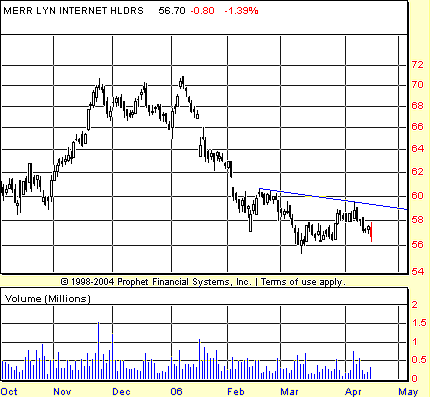
| FIGURE 1: INTERNET HOLDRS, DAILY. A downwardly cast head & shoulders bottom requires a bounce in mid-April to complete the pattern — and perhaps signal a significant move higher in Internet stocks. |
| Graphic provided by: Prophet Financial, Inc. |
| |
| It's hard to imagine a sector for which downward glances have been more appropriate than Internet stocks. Roaring out of 2005, these stocks consolidated somewhat in the final month of that year, only to find them reversing sharply in January and in virtual freefall by February 2006. The low for the decline was made in March around 56, with Internet stocks — basis the Internet HOLDRS or HHH — down some 20% from their year-to-date high (Figure 1). From Wall Street, average investors are encouraged to believe that a bear market is not present until a market has lost 20-25%. Investors in Internet stocks during the first quarter of 2006 may find that their mileage has varied. In fact, there is an argument that, after its 20% decline, the bear market in Internet stocks is closer to its end than its beginning. |
| The agent of that end appears to be a head & shoulders bottom. This head & shoulders bottom developed over the course of February, March, and April, with the left shoulder being formed in the first half of February, the head of the pattern developing from mid-February to the end of March, and the right shoulder a work in progress over the course of April. The neckline of this head & shoulders pattern extends from the February highs to the early April highs and, as such, has a downward cast in which the left side of the pattern is higher than the right. For this pattern to be valid, the current declines in April will have to find some support and move up, all without taking out the March lows (which represents the "head" of the pattern). From such support, HHH would need to rally up and through resistance at the neckline, somewhere around the 59 level. |
|
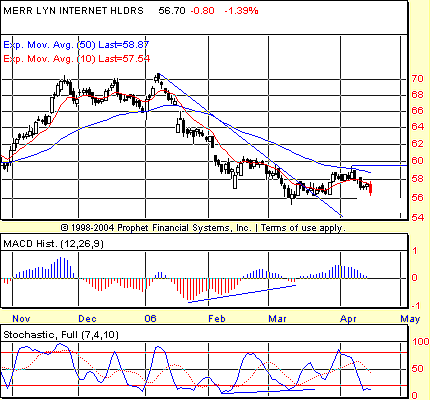
| FIGURE 2: INTERNET HOLDRS, DAILY. Rising lows in both the troughs of the MACD histogram and the stochastic suggest that the Internet HOLDRS may have put in a bottom in the early spring of 2006. |
| Graphic provided by: Prophet Financial, Inc. |
| |
| Other ways to analyze the bullish prospects for HHH include the higher lows in both the moving average convergence/divergence histogram (MACDH) and the stochastic. I tend to rely more on positive divergences in the stochastic compared to the MACDH when looking at daily charts (on weekly charts, the divergences of the MACDH hold more weight for me). Figure 2 shows at least a reason or two why. The positive divergence in the MACDH from January to February did not create a bottom as prices moved lower in early March. However, the bottom suggested by the stochastics' positive divergence from February to March does — as of this writing — indicate a bottom with the March low. Of course, the current short-term decline in HHH in April will tell whethe the March lows were in fact a real bottom. |
| We can also use the 1-2-3 trend reversal method to determine when HHH has progressed from the sell side to the buy side. Recall that the 1-2-3 trend reversal posits three stages that any trend will likely go through en route to a reversal. The first is a break of a major trendline. The second is the attempt to reestablish the trend by setting a new high or low, depending on the direction of the trend. The third comes after the attempt to reestablish the trend has failed and the market moves to and through the price limit set during stage 1. In the case of HHH and the year-to-date downtrend, we can find the "1" in the form of the trendline break in mid-March. The "2" of the reversal is under way now, as HHH is moving downward in an effort to take out the March lows and thus reestablish the downtrend by preventing a significant higher low. What remains is (a) a test of the March lows and, if that is successful, (b) a rally up to and through the price limit set during stage 1. That limit is just shy of 60 — a level where there exists ample resistance not only from the April highs, but also from the highs set in the second half of February. |
Technical Writer for Technical Analysis of STOCKS & COMMODITIES magazine, Working-Money.com, and Traders.com Advantage.
| Title: | Technical Writer |
| Company: | Technical Analysis, Inc. |
| Address: | 4757 California Avenue SW |
| Seattle, WA 98116 | |
| Phone # for sales: | 206 938 0570 |
| Fax: | 206 938 1307 |
| Website: | www.Traders.com |
| E-mail address: | DPenn@traders.com |
Traders' Resource Links | |
| Charting the Stock Market: The Wyckoff Method -- Books | |
| Working-Money.com -- Online Trading Services | |
| Traders.com Advantage -- Online Trading Services | |
| Technical Analysis of Stocks & Commodities -- Publications and Newsletters | |
| Working Money, at Working-Money.com -- Publications and Newsletters | |
| Traders.com Advantage -- Publications and Newsletters | |
| Professional Traders Starter Kit -- Software | |
Click here for more information about our publications!
Comments
Date:�04/18/06Rank:�3Comment:�
Date:�04/19/06Rank:�5Comment:�

Request Information From Our Sponsors
- VectorVest, Inc.
- Executive Premier Workshop
- One-Day Options Course
- OptionsPro
- Retirement Income Workshop
- Sure-Fire Trading Systems (VectorVest, Inc.)
- Trading as a Business Workshop
- VectorVest 7 EOD
- VectorVest 7 RealTime/IntraDay
- VectorVest AutoTester
- VectorVest Educational Services
- VectorVest OnLine
- VectorVest Options Analyzer
- VectorVest ProGraphics v6.0
- VectorVest ProTrader 7
- VectorVest RealTime Derby Tool
- VectorVest Simulator
- VectorVest Variator
- VectorVest Watchdog
- StockCharts.com, Inc.
- Candle Patterns
- Candlestick Charting Explained
- Intermarket Technical Analysis
- John Murphy on Chart Analysis
- John Murphy's Chart Pattern Recognition
- John Murphy's Market Message
- MurphyExplainsMarketAnalysis-Intermarket Analysis
- MurphyExplainsMarketAnalysis-Visual Analysis
- StockCharts.com
- Technical Analysis of the Financial Markets
- The Visual Investor