HOT TOPICS LIST
- MACD
- Fibonacci
- RSI
- Gann
- ADXR
- Stochastics
- Volume
- Triangles
- Futures
- Cycles
- Volatility
- ZIGZAG
- MESA
- Retracement
- Aroon
INDICATORS LIST
LIST OF TOPICS
PRINT THIS ARTICLE
by Paolo Pezzutti
After testing support, eBay's stock is now consolidating.
Position: N/A
Paolo Pezzutti
Author of the book "Trading the US Markets - A Comprehensive Guide to US Markets for International Traders and Investors" - Harriman House (July 2008)
PRINT THIS ARTICLE
TECHNICAL ANALYSIS
A Double Low Chart Pattern On eBay
04/17/06 02:49:09 PMby Paolo Pezzutti
After testing support, eBay's stock is now consolidating.
Position: N/A
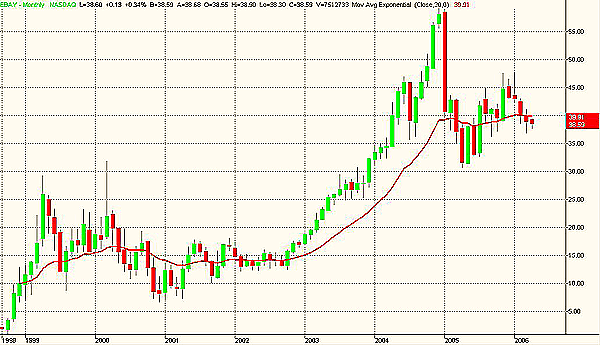
| eBay's principal activity is to operate an online market place and payments platform through websites eBay.com and paypal.com. The company is a leader brand in the Internet community. I had not followed eBay's performance in the stock market very closely in the past, so when I decided to analyze a long-term chart of the stock (Figure 1), I expected to see what is quite common among Internet stocks: a top between 2000 and 2001, followed by a two-year crash and a partial recovery during the past three years. To my great surprise, this was not the case! In fact, after the 2000 top at about $30, an uptrend started in 2001 that brought prices to a high of $59 in December 2004. Following that, a fast selloff in January 2005 opened a sideways phase that is still ongoing. |

|
| FIGURE 1: EBAY, MONTHLY. After the selloff occurred in 2005, eBay partly recovered its losses. |
| Graphic provided by: TradeStation. |
| |
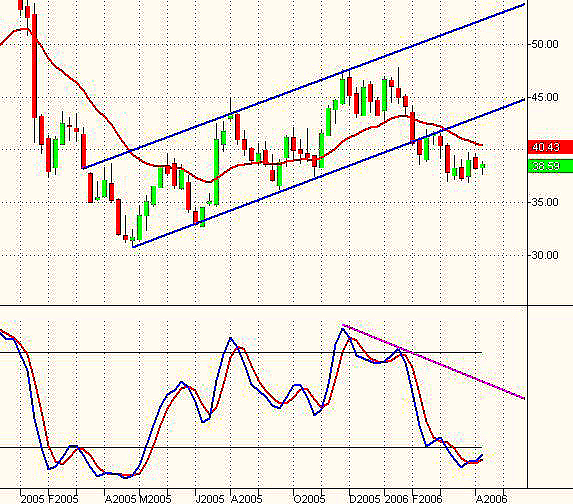
| Since the beginning of 2005, at the weekly level (Figure 2), eBay has been moving within a rising channel composed of two parallel trendlines. In January 2006, eBay printed a double top at $47.85, associated to a negative divergence of the stochastic oscillator. The second top did not manage to tag the upper trendline and prices moved to the downside. The breakout of the lower trendline occurred in February. In the past six weeks, prices have been moving within a congestion near the support level, which is associated with oversold stochastic values. In the intermediate time frame, the technical situation is not positive. |

|
| FIGURE 2: EBAY, WEEKLY. After the breakout of the lower trendline of the rising channel that contained prices for almost a year, eBay is in a congestion near support levels. |
| Graphic provided by: TradeStation. |
| |
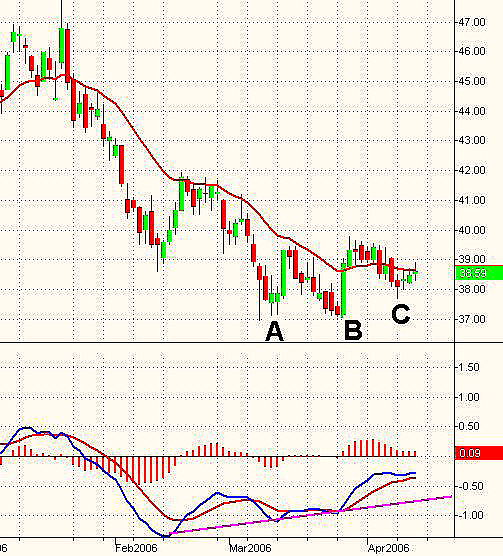
| To better understand the behavior of the stock within the congestion, look at the daily chart in Figure 3. The last leg of the downtrend was initiated on January 20, 2006. The stock failed the test of the resistance at $47 and moved quickly to the downside. Prices reached at point A the important support level of $38, printing a positive divergence of the moving average convergence/divergence (MACD). As you well know, a divergence does not mean that the downtrend is over, but it is a ringing bell to warn you to look at other elements that indicate a reversal is about to occur. Important indications were provided to traders and investors three weeks later, when eBay printed a double low (point B) and showed the strength to react positively at the test of support. A long up white candle was printed on high volumes on March 28. It is a wide-ranging trend day that diplays clearly the path of least resistance for prices: up. Interestingly, after a couple of days, the stock started a long and slow-moving consolidation that has lasted for eight trading sessions. Trading psychology is like that: One day, it seems absolutely vital to buy the stock at any price, as if it were the last chance to buy it. The next day, traders and investors show no interest at all. It is important to understand this type of behavior to see if accumulation or distribution is ongoing during these phases. A relative low was printed on April 10 (point C), and now the stock is moving to the upside toward the resistance area of $39.30. |

|
| FIGURE 3: EBAY, DAILY. A double low printed in March. If it is confirmed, it could project prices to test the $41 area. |
| Graphic provided by: TradeStation. |
| |
| If you are bullish on eBay in the short term you might enter your trade and place a stop-loss below the $37.69 or $36.93 values, depending on your risk tolerance and your trading style. The potential to the upside provides indication of a first projection of prices to the resistance level of $39.30 and the objective of the double low formation at $41.90. |
Author of the book "Trading the US Markets - A Comprehensive Guide to US Markets for International Traders and Investors" - Harriman House (July 2008)
| Address: | VIA ROBERTO AGO 26 POSTAL CODE 00166 |
| Rome, ITALY | |
| Phone # for sales: | +393357540708 |
| E-mail address: | pezzutti.paolo@tiscali.it |
Click here for more information about our publications!
Comments
Date: 04/18/06Rank: 4Comment:

Request Information From Our Sponsors
- StockCharts.com, Inc.
- Candle Patterns
- Candlestick Charting Explained
- Intermarket Technical Analysis
- John Murphy on Chart Analysis
- John Murphy's Chart Pattern Recognition
- John Murphy's Market Message
- MurphyExplainsMarketAnalysis-Intermarket Analysis
- MurphyExplainsMarketAnalysis-Visual Analysis
- StockCharts.com
- Technical Analysis of the Financial Markets
- The Visual Investor
- VectorVest, Inc.
- Executive Premier Workshop
- One-Day Options Course
- OptionsPro
- Retirement Income Workshop
- Sure-Fire Trading Systems (VectorVest, Inc.)
- Trading as a Business Workshop
- VectorVest 7 EOD
- VectorVest 7 RealTime/IntraDay
- VectorVest AutoTester
- VectorVest Educational Services
- VectorVest OnLine
- VectorVest Options Analyzer
- VectorVest ProGraphics v6.0
- VectorVest ProTrader 7
- VectorVest RealTime Derby Tool
- VectorVest Simulator
- VectorVest Variator
- VectorVest Watchdog
