HOT TOPICS LIST
- MACD
- Fibonacci
- RSI
- Gann
- ADXR
- Stochastics
- Volume
- Triangles
- Futures
- Cycles
- Volatility
- ZIGZAG
- MESA
- Retracement
- Aroon
INDICATORS LIST
LIST OF TOPICS
PRINT THIS ARTICLE
by Paolo Pezzutti
The stock prints the pattern with the stochastics oversold
Position: N/A
Paolo Pezzutti
Author of the book "Trading the US Markets - A Comprehensive Guide to US Markets for International Traders and Investors" - Harriman House (July 2008)
PRINT THIS ARTICLE
CANDLESTICK CHARTING
Harami Candlestick Pattern: Ford
04/17/06 02:16:31 PMby Paolo Pezzutti
The stock prints the pattern with the stochastics oversold
Position: N/A
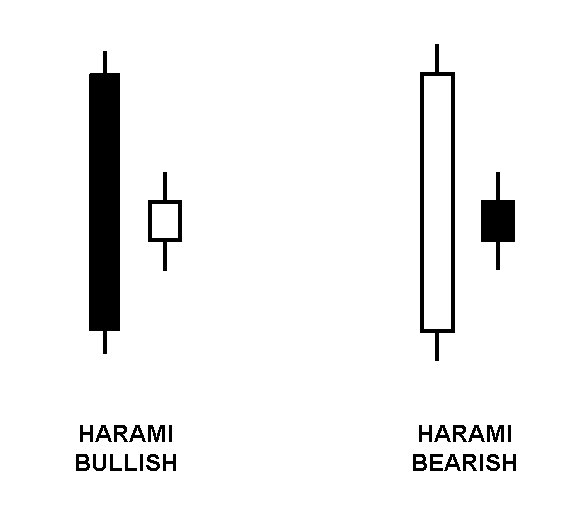
| One of the major candlestick signals is called the harami. The bullish harami is a two-candle pattern. The first candle is usually a large black one. The second candle opens above the previous day's close and closes below the previous day's open. The pattern is more effective when the second, smaller candlestick is a doji (a candlestick with no, or a very small, body). Harami means "pregnant" in Japanese. A harami at the support level, associated with other indicators, can provide indications of a significant reversal. For example, you can use stochastics or moving average convergence/divergence (MACD) to find confirmations. The psychology of this pattern is the following: in a downtrend there is a day of strong selling. The next day, the open gaps up. Traders who are short begin covering, and the price finishes slightly positive for the day, often with high volume. This creates a support that can be interpreted as lack of strength to continue to the downside. A strong day on the following trading session would confirm the reversal. |

|
| FIGURE 1: HARAMI PATTERNS. Their indication for a potential reversal are reinforced when confirmed with other indicators |
| Graphic provided by: powerpoint. |
| |
| Indications, as far as how strong the reversal might be, come from the second candle of the pattern. If the harami closes near the top of the previous day's black candle, the new uptrend may be very strong. A trendline, a moving average line, or other support areas can confirm the validity of the pattern. The bearish harami is the exact opposite of the bullish harami (Figure 1). |

|
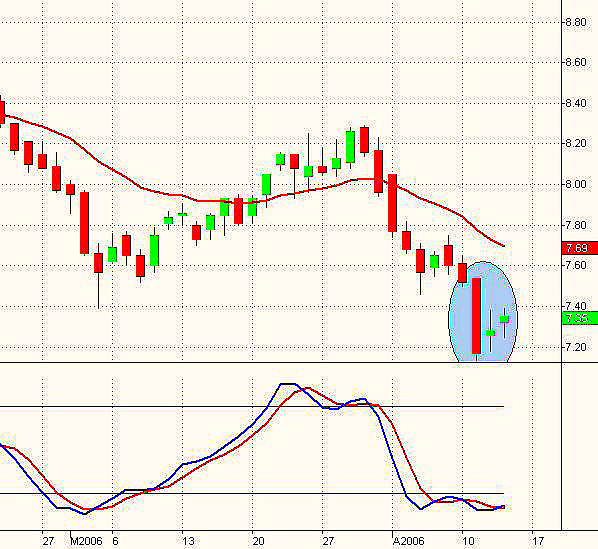
| FIGURE 2: FORD, DAILY. The stock has printed a harami pattern confirmed with the stochastics oversold pattern. When applying proper risk management, this pattern has good risk-reward characteristics. |
| Graphic provided by: TradeStation. |
| |
| In Figure 2, you can see the daily chart of Ford (F). The stock is in a clear downtrend, and on April 11 prints a breakout of the previous pivot low of March 3. The trading session prints a long black candle, a wide-ranging trend day with open and close very near, respectively, to the high and the low of the day. The next day, the open gaps up and the close of the day is positive, but within the previous day's range. As the price action develops near the low of the black candle, you do not expect to see a strong reversal. The stochastics oversold confirms the validity of the pattern. However, if you want to take this trade, the most important thing is risk management. It is clear that the trade implies a risk of failure. Placing a stop-loss below the black candle low and applying a trailing stop technique, should the trade move in a favorable direction, might be an option. |
Author of the book "Trading the US Markets - A Comprehensive Guide to US Markets for International Traders and Investors" - Harriman House (July 2008)
| Address: | VIA ROBERTO AGO 26 POSTAL CODE 00166 |
| Rome, ITALY | |
| Phone # for sales: | +393357540708 |
| E-mail address: | pezzutti.paolo@tiscali.it |
Click here for more information about our publications!
Comments
Date: 04/18/06Rank: 4Comment:
Date: 04/19/06Rank: 5Comment:
Date: 05/24/06Rank: 5Comment:

Request Information From Our Sponsors
- StockCharts.com, Inc.
- Candle Patterns
- Candlestick Charting Explained
- Intermarket Technical Analysis
- John Murphy on Chart Analysis
- John Murphy's Chart Pattern Recognition
- John Murphy's Market Message
- MurphyExplainsMarketAnalysis-Intermarket Analysis
- MurphyExplainsMarketAnalysis-Visual Analysis
- StockCharts.com
- Technical Analysis of the Financial Markets
- The Visual Investor
- VectorVest, Inc.
- Executive Premier Workshop
- One-Day Options Course
- OptionsPro
- Retirement Income Workshop
- Sure-Fire Trading Systems (VectorVest, Inc.)
- Trading as a Business Workshop
- VectorVest 7 EOD
- VectorVest 7 RealTime/IntraDay
- VectorVest AutoTester
- VectorVest Educational Services
- VectorVest OnLine
- VectorVest Options Analyzer
- VectorVest ProGraphics v6.0
- VectorVest ProTrader 7
- VectorVest RealTime Derby Tool
- VectorVest Simulator
- VectorVest Variator
- VectorVest Watchdog
