HOT TOPICS LIST
- MACD
- Fibonacci
- RSI
- Gann
- ADXR
- Stochastics
- Volume
- Triangles
- Futures
- Cycles
- Volatility
- ZIGZAG
- MESA
- Retracement
- Aroon
INDICATORS LIST
LIST OF TOPICS
PRINT THIS ARTICLE
by Gary Grosschadl
Allegheny Technologies is currently trading at nose-bleed levels above $65. How it got there (in part) contains an interesting trading lesson.
Position: N/A
Gary Grosschadl
Independent Canadian equities trader and technical analyst based in Peterborough
Ontario, Canada.
PRINT THIS ARTICLE
BREAKOUTS
Failure Patterns Can Lead To Great Trades
04/17/06 08:01:11 AMby Gary Grosschadl
Allegheny Technologies is currently trading at nose-bleed levels above $65. How it got there (in part) contains an interesting trading lesson.
Position: N/A
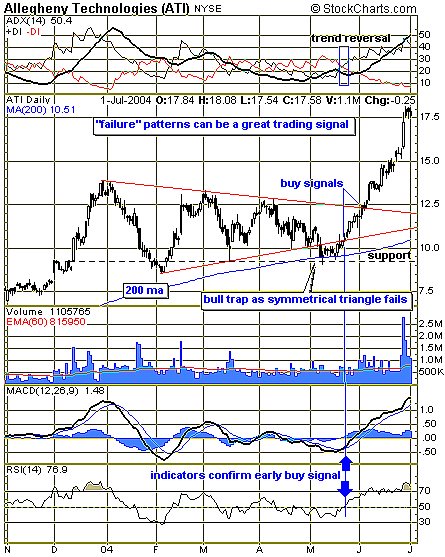
| Take a look at this daily chart (Figure 1) from 2004, but ignore for the moment the 200-day exponential moving average (EMA) and the dotted support line. What the pure pattern trader would see is a triangle failure punctuated with a large black or down candlestick. Aggressive traders upon seeing this formation may enter or contemplate placing a short trade (betting on more downside) at this point. This would have been a disastrous move for stubborn traders not protecting themselves with a stop-loss position. |
| As it turns out, this pattern failure turned out to be a "bear trap," as not only was this position reversed but it ran the other way for a very profitable breakout. The prime lesson here is that when you spot a bull or bear trap, a great trade is often developing. Even those traders initially caught on the wrong side of the tracks, if they had the presence of mind to swallow their false pride, could quickly change gears and partake in the real move albeit in the opposite direction. The axiom here is "Never argue with the market as the market is always right." This is precisely why smart traders always place a stop-loss. The correct mindset for any breakout is, "Hm, this is a possible breakout/breakdown." The market will either confirm or deny the move for those traders who choose to listen and observe. |
| Another lesson here is to always weigh the evidence garnished from other technical viewpoints. The obvious one here is the 200-day moving average (MA). In this case, it is the simple MA, as opposed to the exponential MA (EMA). Most times, I prefer the exponential version, but I often consider its sister if the stock rests at that point. The other support level is indicated by the dotted line as it relates to previous support via a long-tailed candlestick and a previous resistance level from late 2003. Yes, Virginia, stocks often respect previous support and resistance levels. |

|
| FIGURE 1: ALLEGHENY TECHNOLOGIES, DAILY, 2004. This "old" chart of ATI can give the trader willing to look at the past something to chew on for the future. |
| Graphic provided by: StockCharts.com. |
| |
| Hindsight shows two possible buy signals. First, there is the early signal, as the stock climbed back inside the symmetrical triangle. For aggressive traders, this signal was supported by several indicators. At the top of the chart, a trend reversal was indicated as the directional indicators (DIs) crossed, showing a swing to bullish power (+DI). The graph below Figure 1 shows a bullish crossover of the moving average convergence/divergence (MACD) through its thinner signal line. The relative strength index (RSI) shows a move above its key 50 level. Second, the later buy signal for the more cautious or conservative trader came as the stock broke outside of the upper trendline (that's right, as in, "Hm ... this is a possible breakout"). Note how this related to the average directional movement index (ADX) (uppermost graph again) as it rose to its proper bullish stance between the DIs and rose through the 20 level. This indicates a strong trend likely developing. |
| In summary, whether or not you are looking for enlightenment, reflection is a good thing. Looking back at big moves to see where you or other traders went right or wrong is a worthwhile exercise. |
Independent Canadian equities trader and technical analyst based in Peterborough
Ontario, Canada.
| Website: | www.whatsonsale.ca/financial.html |
| E-mail address: | gwg7@sympatico.ca |
Click here for more information about our publications!
Comments
Date: 04/18/06Rank: 5Comment:
Date: 04/18/06Rank: 5Comment:

Request Information From Our Sponsors
- StockCharts.com, Inc.
- Candle Patterns
- Candlestick Charting Explained
- Intermarket Technical Analysis
- John Murphy on Chart Analysis
- John Murphy's Chart Pattern Recognition
- John Murphy's Market Message
- MurphyExplainsMarketAnalysis-Intermarket Analysis
- MurphyExplainsMarketAnalysis-Visual Analysis
- StockCharts.com
- Technical Analysis of the Financial Markets
- The Visual Investor
- VectorVest, Inc.
- Executive Premier Workshop
- One-Day Options Course
- OptionsPro
- Retirement Income Workshop
- Sure-Fire Trading Systems (VectorVest, Inc.)
- Trading as a Business Workshop
- VectorVest 7 EOD
- VectorVest 7 RealTime/IntraDay
- VectorVest AutoTester
- VectorVest Educational Services
- VectorVest OnLine
- VectorVest Options Analyzer
- VectorVest ProGraphics v6.0
- VectorVest ProTrader 7
- VectorVest RealTime Derby Tool
- VectorVest Simulator
- VectorVest Variator
- VectorVest Watchdog
