HOT TOPICS LIST
- MACD
- Fibonacci
- RSI
- Gann
- ADXR
- Stochastics
- Volume
- Triangles
- Futures
- Cycles
- Volatility
- ZIGZAG
- MESA
- Retracement
- Aroon
INDICATORS LIST
LIST OF TOPICS
PRINT THIS ARTICLE
by David Penn
Negative divergences in the NYSE suggest sideways action in the second half of April.
Position: N/A
David Penn
Technical Writer for Technical Analysis of STOCKS & COMMODITIES magazine, Working-Money.com, and Traders.com Advantage.
PRINT THIS ARTICLE
CONSOLID FORMATION
More Sideways
04/14/06 02:03:37 PMby David Penn
Negative divergences in the NYSE suggest sideways action in the second half of April.
Position: N/A
| From Merriam-Webster: Sideways (adj): to get into a rage or state of distress Sideways (adj): used to describe a state of exceptional inebriation Sideways (adj): in a lateral direction While the third of those definitions perhaps will do a better job of describing likely market behavior over the next few days, the first two -- of fury and drunkenness -- perhaps describe trader and investor behavior in more recent times, at a market that can't go up and refuses to go down. |

|
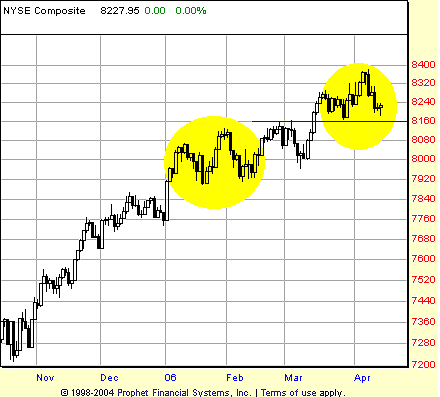
| FIGURE 1: NEW YORK STOCK EXCHANGE COMPOSITE, DAILY. The consolidation from mid-March to mid-April looks remarkably similar to the consolidation that developed in January — a consolidation that ultimately led to higher prices. |
| Graphic provided by: Prophet Financial, Inc. |
| |
| To say that the current market is one that "can't go up" is perhaps a bit unfair. While the NASDAQ Composite, Dow Jones industrials, and Standard & Poor's 500 have meandered in trading ranges (albeit with a slight upward bias), stocks represented by the Russell 2000 and the New York Stock Exchange Composite (Figure 1) have enjoyed a relatively more directional ride since the March bottom. Still, a sense of "going nowhere fast" pervades the marketplace for equities -- and that only where outright bearishness has not yet taken hold. |
| What are the prospects of an end to this market meandering? The current consolidation bears an interesting resemblance to the consolidation in January and February. What is worth noting about the January/February consolidation is that by mid-February, the market appeared en route to forming a head & shoulders top. A breakdown from such a head & shoulders top would have likely taken out the December lows, causing significant technical damage to the market. However, the would-be right shoulder of that would-be head & shoulders kept on rising higher until it eventually set a new high for the rally that began back in October 2005. After an early March pullback, the market was off again, setting a new rally high in mid-month. |

|
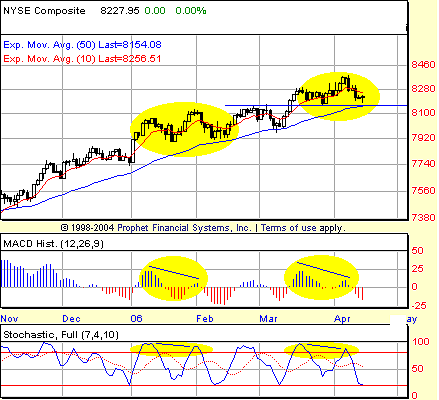
| FIGURE 2: NEW YORK STOCK EXCHANGE COMPOSITE, DAILY. Negative divergences in the stochastic and the MACD histogram (MACDH) suggested a correction in the early spring that turned out to be a buying opportunity. Do negative divergences in March/April hint at a similar opportunity? |
| Graphic provided by: Prophet Financial, Inc. |
| |
| Figure 2 highlights some of the similarities between where the market is now and where the market was at the beginning of the year. In both cases, clear negative divergences had formed in both the stochastic and the moving average convergence/divergence histogram (MACDH), while prices were carving out the first two-thirds of what increasingly appeared to be head & shoulders tops. We know now that the negative divergences shown in January/February led not to a reversal, but to another month of largely sideways trading before putting in a bottom and breaking beyond a level that, as far as the NYSE is concerned, still remains as support. |
| Other markets that broke out in mid-March have not been able to "hold the breakout." Neither the S&P 500 nor the Dow industrials have held their March breakouts (although the Russell 2000 has). But that breakout level remains a source of support for the NYSE; note also that the breakout level coincides with the 50-day exponential moving average (EMA), and is a "line in the sand" worth watching. Given the confluence of support at current levels (that is, old resistance and the 50-day EMA), it would come as little surprise if -- instead of melting down -- the negative divergences currently in the $NYA were resolved by sideways movement. Note also the increasingly oversold condition of the market has been suggested by both the stochastic's and the MACDH's currently low levels. Stochastic levels this low have indicated bottoms in each of the last three times in recent months, with even milder oversold readings (such as in late March and early January), creating multiday rallies. |
Technical Writer for Technical Analysis of STOCKS & COMMODITIES magazine, Working-Money.com, and Traders.com Advantage.
| Title: | Technical Writer |
| Company: | Technical Analysis, Inc. |
| Address: | 4757 California Avenue SW |
| Seattle, WA 98116 | |
| Phone # for sales: | 206 938 0570 |
| Fax: | 206 938 1307 |
| Website: | www.Traders.com |
| E-mail address: | DPenn@traders.com |
Traders' Resource Links | |
| Charting the Stock Market: The Wyckoff Method -- Books | |
| Working-Money.com -- Online Trading Services | |
| Traders.com Advantage -- Online Trading Services | |
| Technical Analysis of Stocks & Commodities -- Publications and Newsletters | |
| Working Money, at Working-Money.com -- Publications and Newsletters | |
| Traders.com Advantage -- Publications and Newsletters | |
| Professional Traders Starter Kit -- Software | |
Click here for more information about our publications!
Comments
Date: 04/15/06Rank: 3Comment:
Date: 04/20/06Rank: 4Comment:

Request Information From Our Sponsors
- VectorVest, Inc.
- Executive Premier Workshop
- One-Day Options Course
- OptionsPro
- Retirement Income Workshop
- Sure-Fire Trading Systems (VectorVest, Inc.)
- Trading as a Business Workshop
- VectorVest 7 EOD
- VectorVest 7 RealTime/IntraDay
- VectorVest AutoTester
- VectorVest Educational Services
- VectorVest OnLine
- VectorVest Options Analyzer
- VectorVest ProGraphics v6.0
- VectorVest ProTrader 7
- VectorVest RealTime Derby Tool
- VectorVest Simulator
- VectorVest Variator
- VectorVest Watchdog
- StockCharts.com, Inc.
- Candle Patterns
- Candlestick Charting Explained
- Intermarket Technical Analysis
- John Murphy on Chart Analysis
- John Murphy's Chart Pattern Recognition
- John Murphy's Market Message
- MurphyExplainsMarketAnalysis-Intermarket Analysis
- MurphyExplainsMarketAnalysis-Visual Analysis
- StockCharts.com
- Technical Analysis of the Financial Markets
- The Visual Investor
