HOT TOPICS LIST
- MACD
- Fibonacci
- RSI
- Gann
- ADXR
- Stochastics
- Volume
- Triangles
- Futures
- Cycles
- Volatility
- ZIGZAG
- MESA
- Retracement
- Aroon
INDICATORS LIST
LIST OF TOPICS
PRINT THIS ARTICLE
by David Penn
A MACDH spike and a bull flag suggest the possibility of upside in shares of Apple Computer.
Position: N/A
David Penn
Technical Writer for Technical Analysis of STOCKS & COMMODITIES magazine, Working-Money.com, and Traders.com Advantage.
PRINT THIS ARTICLE
FLAGS AND PENNANTS
All Aboard Apple?
04/14/06 01:36:50 PMby David Penn
A MACDH spike and a bull flag suggest the possibility of upside in shares of Apple Computer.
Position: N/A
| Apple Computer (AAPL) is one of those stocks I wished I'd owned back in late 2005. Then it became one of those stocks I wished I'd shorted here in the first few months of 2006. Looking at how AAPL is opening up the second quarter of 2006 — with a big-volume bounce off the bottom and high-volume gaps up in the days immediately following — it looks as if it may be time to fall in love with Apple all over again. |

|
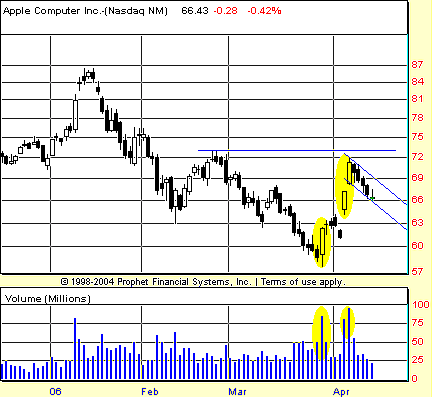
| FIGURE 1: APPLE COMPUTER, DAILY. The bounce in AAPL runs into resistance in the 72 area. Note the low volume during the pullback in early April. Compare that to the volume during accumulation days in late March and as Apple is making its high in April. |
| Graphic provided by: Prophet Financial, Inc. |
| |
| Apple's current chart provides a number of worthwhile things for technical analysts to consider. Most important, of course, are price and volume. So consider what we can tell about price and volume in shares of Apple, as shown in Figure 1. From the end of March until mid-April, there were only three up days. But look at the volume that accompanied those days! These are true signs of accumulation that should hearten Apple bulls and give pause to Apple bears. Note also how the stock gapped up immediately after a brief pullback in the first few days of April. The combination of big-volume up days and gap-up openings that close the session higher are credible indications of a stock that is determined to go higher. |
| Consider also the pullback moving from early April to mid-April. Four losing sessions might have been hard on the nerves of those who bought into Apple near its April high, but those sessions weren't especially hard on the stock, which took four sessions to retrace what was accomplished in one session (including the gap up). Coming after a bear trend like the one Apple endured beginning in the middle of January, this kind of action (in which stocks move up faster than they move down) is another indication that the attitude toward Apple has shifted from one with a negative bias to one with a more positive one. |

|
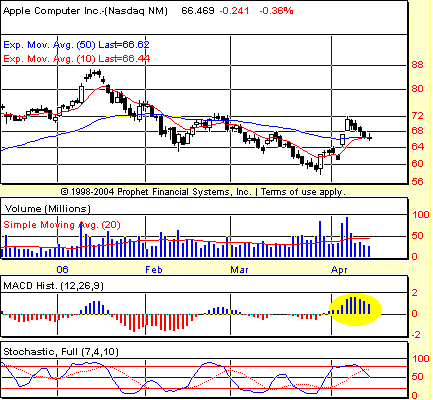
| FIGURE 2: APPLE COMPUTER, DAILY. The "spike" in the moving average convergence/divergence histogram (MACDH) in April is a sign that the stock may have bottomed and could be ready to embark upon a new uptrend. |
| Graphic provided by: Prophet Financial, Inc. |
| |
| The pullback in AAPL in April appears to have taken the form of a bull flag. Generally, bull flags appear as continuation patterns, meaning that the resolution of a flag tends to mean more price action in the direction of the trend leading up to the flag. If that direction were downward with a flag that pointed upward, then the flag would be considered a bear flag. If the direction were upward with a flag that pointed downward (such as the one here), then the flag would be considered a bull flag. |
| Assuming that the pullback in April is indeed a flag and a bull flag at that, we can make projections as to how far a breakout might take the stock. The measurement rule for flags is to take the distance from the beginning of the preceding trend to the top of the pattern (a distance from approximately 58 to 72, or 14 points) and add that amount to the value at the bottom of the pattern (so far, approximately 66). This gives us a minimum upside of 66 + 14 or 80. Such a minimum move would vault Apple back in the neighborhood of its year-to-date high just shy of $88, reached in mid-January. |
Technical Writer for Technical Analysis of STOCKS & COMMODITIES magazine, Working-Money.com, and Traders.com Advantage.
| Title: | Technical Writer |
| Company: | Technical Analysis, Inc. |
| Address: | 4757 California Avenue SW |
| Seattle, WA 98116 | |
| Phone # for sales: | 206 938 0570 |
| Fax: | 206 938 1307 |
| Website: | www.Traders.com |
| E-mail address: | DPenn@traders.com |
Traders' Resource Links | |
| Charting the Stock Market: The Wyckoff Method -- Books | |
| Working-Money.com -- Online Trading Services | |
| Traders.com Advantage -- Online Trading Services | |
| Technical Analysis of Stocks & Commodities -- Publications and Newsletters | |
| Working Money, at Working-Money.com -- Publications and Newsletters | |
| Traders.com Advantage -- Publications and Newsletters | |
| Professional Traders Starter Kit -- Software | |
Click here for more information about our publications!
Comments
Date: 04/15/06Rank: 4Comment:
Date: 04/16/06Rank: 5Comment:

|

Request Information From Our Sponsors
- StockCharts.com, Inc.
- Candle Patterns
- Candlestick Charting Explained
- Intermarket Technical Analysis
- John Murphy on Chart Analysis
- John Murphy's Chart Pattern Recognition
- John Murphy's Market Message
- MurphyExplainsMarketAnalysis-Intermarket Analysis
- MurphyExplainsMarketAnalysis-Visual Analysis
- StockCharts.com
- Technical Analysis of the Financial Markets
- The Visual Investor
- VectorVest, Inc.
- Executive Premier Workshop
- One-Day Options Course
- OptionsPro
- Retirement Income Workshop
- Sure-Fire Trading Systems (VectorVest, Inc.)
- Trading as a Business Workshop
- VectorVest 7 EOD
- VectorVest 7 RealTime/IntraDay
- VectorVest AutoTester
- VectorVest Educational Services
- VectorVest OnLine
- VectorVest Options Analyzer
- VectorVest ProGraphics v6.0
- VectorVest ProTrader 7
- VectorVest RealTime Derby Tool
- VectorVest Simulator
- VectorVest Variator
- VectorVest Watchdog
