HOT TOPICS LIST
- MACD
- Fibonacci
- RSI
- Gann
- ADXR
- Stochastics
- Volume
- Triangles
- Futures
- Cycles
- Volatility
- ZIGZAG
- MESA
- Retracement
- Aroon
INDICATORS LIST
LIST OF TOPICS
PRINT THIS ARTICLE
by Paolo Pezzutti
Wedges are chart patterns that provide reliable indications to traders.
Position: N/A
Paolo Pezzutti
Author of the book "Trading the US Markets - A Comprehensive Guide to US Markets for International Traders and Investors" - Harriman House (July 2008)
PRINT THIS ARTICLE
WEDGE FORMATIONS
Continuation Pattern: Wedge
04/17/06 01:22:41 PMby Paolo Pezzutti
Wedges are chart patterns that provide reliable indications to traders.
Position: N/A
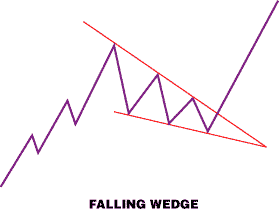
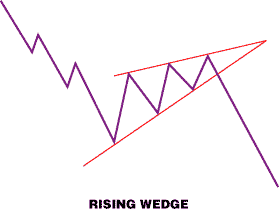
| A wedge formation is similar to a symmetrical triangle. The shape and the amount of time it takes to form are closely related. It is identifiable by two converging trendlines that come together at an apex. On a daily chart, a wedge can last generally from 20 to 60 trading sessions, but you can see it developing on any time frame. It is different from triangles, wedges are easily distinguished because of their slant either to the upside or the downside. Similar to flags, wedges develop their formation against the prevailing trend. A falling wedge is therefore considered a bullish formation (Figure 1). A rising wedge, in contrast, is considered is a bearish formation (Figure 2), in that volume should diminish as the pattern forms. If volume remains the same or increases, this signal is less reliable. |

|
| FIGURE 1: FALLING WEDGE. The falling wedge is a bullish formation that occurs within an uptrend. |
| Graphic provided by: powerpoint. |
| |
| In Figures 1 and 2, you can see a representation of the two types of wedge. The downward slant is characteristic of a bullish wedge with the price action contained within two converging trendlines. The opposite is true for the rising wedge. Generally, wedges represent a pause or, better, a consolidation phase within the existing trend. They can be viewed as continuation patterns. Wedges are not very common. Actually, flags, pennants, and triangles are printed on charts more frequently. Sometimes, they can be observed at tops or bottoms near the end of the trend. After a prolonged uptrend, a rising wedge is a bearish formation. Volatility decreases while prices do not manage to advance significantly. Investors gradually lose confidence in the ongoing market action, and finally, prices break out to the downside. This pattern, however, is much less common, although it is quite reliable. |

|
| FIGURE 2: RISING WEDGE. The rising wedge is a bearish formation. |
| Graphic provided by: powerpoint. |
| |
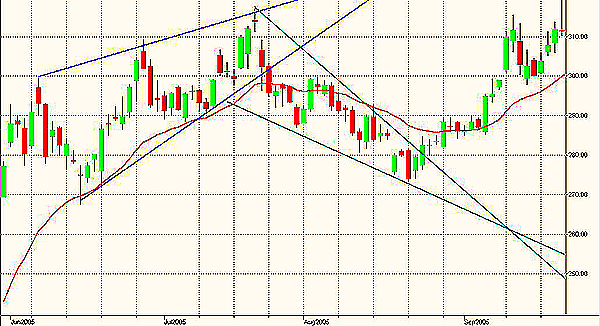
| The typical falling and rising wedges interpreted as continuation patterns have been studied by, among others, STOCKS & COMMODITIES Contributing Writer Thomas Bulkowski in his Encyclopedia Of Chart Patterns. Because of their reliability and charting characteristics, trading these patterns favor risk control. In actuality, there is little need to wait for the breakout before buying the stock. However, since prices are trending down, either you manage to enter your trade when testing the lower trendline in a falling wedge toward the presumable apex of the formation or it may be to your advantage to wait for the upside breakout. By waiting, you might enter at a lower price than if you buy earlier, increasing your chances of success. Bulkowski notes that after a breakout, 98% of all falling wedges continue rising by more than 5%. In Figure 3, you can see an example of this pattern on the Google (GOOG) daily chart. The first formation is a rising wedge at the end of an uptrend developed between June and July 2005. Prices printed a top and subsequently moved below the lower trendline, starting a downtrend. The next month, a bullish wedge was developed. When prices moved outside the formation to the upside, volatility increased, developing a directional move. |

|
| FIGURE 3: GOOGLE. GOOG printed a rising wedge as a bearish formation at the end of an uptrend. The next falling wedge represented a consolidation phase in the original uptrend |
| Graphic provided by: TradeStation. |
| |
| Wedges do not occur very frequently, but they provide reliable indications. In applying proper risk management, they represent another tool in your library of techniques. |
Author of the book "Trading the US Markets - A Comprehensive Guide to US Markets for International Traders and Investors" - Harriman House (July 2008)
| Address: | VIA ROBERTO AGO 26 POSTAL CODE 00166 |
| Rome, ITALY | |
| Phone # for sales: | +393357540708 |
| E-mail address: | pezzutti.paolo@tiscali.it |
Click here for more information about our publications!
Comments
Date: 04/18/06Rank: 4Comment:
Date: 04/20/06Rank: 5Comment:

Request Information From Our Sponsors
- VectorVest, Inc.
- Executive Premier Workshop
- One-Day Options Course
- OptionsPro
- Retirement Income Workshop
- Sure-Fire Trading Systems (VectorVest, Inc.)
- Trading as a Business Workshop
- VectorVest 7 EOD
- VectorVest 7 RealTime/IntraDay
- VectorVest AutoTester
- VectorVest Educational Services
- VectorVest OnLine
- VectorVest Options Analyzer
- VectorVest ProGraphics v6.0
- VectorVest ProTrader 7
- VectorVest RealTime Derby Tool
- VectorVest Simulator
- VectorVest Variator
- VectorVest Watchdog
- StockCharts.com, Inc.
- Candle Patterns
- Candlestick Charting Explained
- Intermarket Technical Analysis
- John Murphy on Chart Analysis
- John Murphy's Chart Pattern Recognition
- John Murphy's Market Message
- MurphyExplainsMarketAnalysis-Intermarket Analysis
- MurphyExplainsMarketAnalysis-Visual Analysis
- StockCharts.com
- Technical Analysis of the Financial Markets
- The Visual Investor
