HOT TOPICS LIST
- MACD
- Fibonacci
- RSI
- Gann
- ADXR
- Stochastics
- Volume
- Triangles
- Futures
- Cycles
- Volatility
- ZIGZAG
- MESA
- Retracement
- Aroon
INDICATORS LIST
LIST OF TOPICS
PRINT THIS ARTICLE
by Arthur Hill
As sharp as the decline in bonds has been, a key momentum oscillator has positive divergence working and support is at hand.
Position: Accumulate
Arthur Hill
Arthur Hill is currently editor of TDTrader.com, a website specializing in trading strategies, sector/industry specific breadth stats and overall technical analysis. He passed the Society of Technical Analysts (STA London) diploma exam with distinction is a Certified Financial Technician (CFTe). Prior to TD Trader, he was the Chief Technical Analyst for Stockcharts.com and the main contributor to the ChartSchool.
PRINT THIS ARTICLE
CHANNEL LINES
Picking A Bottom In Bonds
04/11/06 11:50:32 AMby Arthur Hill
As sharp as the decline in bonds has been, a key momentum oscillator has positive divergence working and support is at hand.
Position: Accumulate
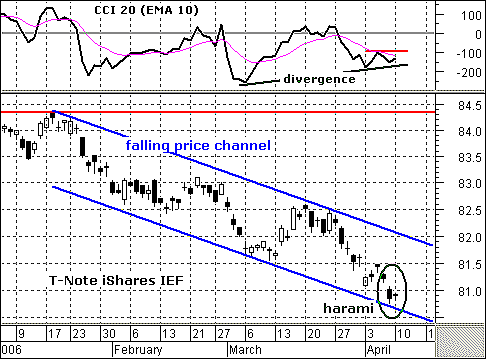
| The year 2006 has not been a nice one for the iShares seven to 10-year Treasury bond fund (IEF). Even though the move looks small on a percentage basis, the decline over the last 11 weeks was the sharpest since the first half of 2004. Despite this apparent freefall, IEF reached channel support and formed a potentially bullish candlestick reversal. |

|
| FIGURE 1: IEF, DAILY. While the current year has not been the strongest for the iShares seven- to 10-year Treasury bond fund, there is a light at the end of the tunnel. |
| Graphic provided by: MetaStock. |
| |
| The falling price channel is based on the upper trendline, which was drawn first (Figure 1). The lower was then drawn parallel to the upper trendline and it extends down to the 80.65 area. IEF closed just below 81 over the last two days and this lower trendline extension now offers support. Even though the big trend remains down, the move to this lower trendline created an oversold situation and the stock is ripe for a bounce or consolidation. |
| Signs of support are emerging as the stock formed a harami over the last two days. The first candlestick is black and shows weakness. The second candlestick of the harami is inside the first, which shows sudden indecision. Stopping the fall is the first step to a reversal, and the harami fulfills this requirement. A move above 81.2 would fill the April 7th gap and confirm the harami. |
| The third positive sign is the positive divergence in the commodity channel index (CCI). This momentum oscillator dipped below -200 in early March and held above this low in early April. The higher low shows less downside momentum and makes for a positive divergence. I applied a 10-day EMA to the indicator and this acts as a trigger (like the MACD signal line). A move above would be a short-term positive. |
Arthur Hill is currently editor of TDTrader.com, a website specializing in trading strategies, sector/industry specific breadth stats and overall technical analysis. He passed the Society of Technical Analysts (STA London) diploma exam with distinction is a Certified Financial Technician (CFTe). Prior to TD Trader, he was the Chief Technical Analyst for Stockcharts.com and the main contributor to the ChartSchool.
| Title: | Editor |
| Company: | TDTrader.com |
| Address: | Willem Geetsstraat 17 |
| Mechelen, B2800 | |
| Phone # for sales: | 3215345465 |
| Website: | www.tdtrader.com |
| E-mail address: | arthurh@tdtrader.com |
Traders' Resource Links | |
| TDTrader.com has not added any product or service information to TRADERS' RESOURCE. | |
Click here for more information about our publications!
Comments
Date: 04/11/06Rank: 4Comment:
Date: 04/12/06Rank: 4Comment:
Date: 04/19/06Rank: 3Comment:

Request Information From Our Sponsors
- StockCharts.com, Inc.
- Candle Patterns
- Candlestick Charting Explained
- Intermarket Technical Analysis
- John Murphy on Chart Analysis
- John Murphy's Chart Pattern Recognition
- John Murphy's Market Message
- MurphyExplainsMarketAnalysis-Intermarket Analysis
- MurphyExplainsMarketAnalysis-Visual Analysis
- StockCharts.com
- Technical Analysis of the Financial Markets
- The Visual Investor
- VectorVest, Inc.
- Executive Premier Workshop
- One-Day Options Course
- OptionsPro
- Retirement Income Workshop
- Sure-Fire Trading Systems (VectorVest, Inc.)
- Trading as a Business Workshop
- VectorVest 7 EOD
- VectorVest 7 RealTime/IntraDay
- VectorVest AutoTester
- VectorVest Educational Services
- VectorVest OnLine
- VectorVest Options Analyzer
- VectorVest ProGraphics v6.0
- VectorVest ProTrader 7
- VectorVest RealTime Derby Tool
- VectorVest Simulator
- VectorVest Variator
- VectorVest Watchdog
