HOT TOPICS LIST
- MACD
- Fibonacci
- RSI
- Gann
- ADXR
- Stochastics
- Volume
- Triangles
- Futures
- Cycles
- Volatility
- ZIGZAG
- MESA
- Retracement
- Aroon
INDICATORS LIST
LIST OF TOPICS
PRINT THIS ARTICLE
by Gary Grosschadl
Denison Mines, trading on the Toronto Stock Exchange, is one of only two publicly traded companies involved in uranium mining and production in Canada.
Position: Buy
Gary Grosschadl
Independent Canadian equities trader and technical analyst based in Peterborough
Ontario, Canada.
PRINT THIS ARTICLE
CHART ANALYSIS
Uranium Miner On An Upleg
04/11/06 11:39:09 AMby Gary Grosschadl
Denison Mines, trading on the Toronto Stock Exchange, is one of only two publicly traded companies involved in uranium mining and production in Canada.
Position: Buy
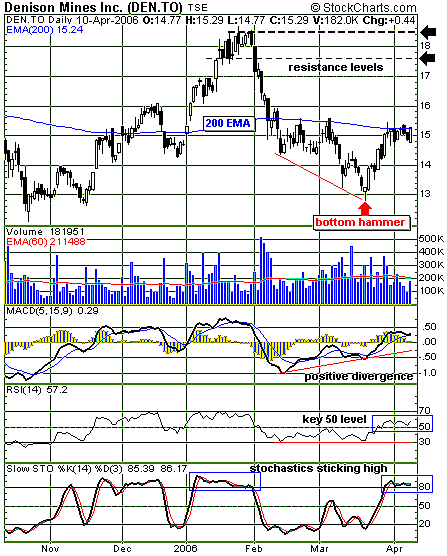
| Denison Mines (DEN) has corrected off its February high of 18.50 on Figure 1. Several technical indications are displayed that may bode well for further price appreciation. |
| First off, a hammer candlestick is shown. This often indicates a bottom is being hammered out, ideally on a higher-volume spike. This needs to be confirmed higher in the next day or two, and it was. Note on the previous failed hammer (black real body), seven trading sessions ago, the confirmation was suspect with the long upper shadows. Second, we can see a positive divergence to price action on the moving average convergence/divergence (MACD) and the relative strength index (RSI). Divergences are generally more reliable signals in the technical arena. Note how this positive divergence is accompanied with a bullish crossover of lines on the MACD and a move above the often key area of 50 on the RSI. In addition, note the bottom graph depicting the stochastic oscillator. Although this oscillator is in overbought territory, this indicator can "stick high" when a strong trend is in place. The upsloping MACD, now above the zero line, agrees with a strong trend in place. |

|
| FIGURE 1: DEN, DAILY. Denison Mines is a Canadian uranium miner, one of only two publicly traded companies involved in uranium mining and production in Canada. |
| Graphic provided by: StockCharts.com. |
| |
| The final bullish harbinger shown is the ever-important 200-period moving average (in this case, the more sensitive exponential moving average [EMA]). A move above or below this important moving average is often telling. With this latest candlestick, we have the first close above this line. Should this confirm higher, then there is a stronger likelihood of a rise to higher resistance levels. |
| Figure 1, the daily chart, shows several short-term resistance targets. The $17 mark represents a previous resistance level, 17.60 a previous support, and the 18.50 level another resistance via a former high. Expect possible reversals at any of these points, or at least a pause while the bulls contemplate another upswing. Should the stock fall below the 200-day EMA once again, then all bullish bets are off. |
Independent Canadian equities trader and technical analyst based in Peterborough
Ontario, Canada.
| Website: | www.whatsonsale.ca/financial.html |
| E-mail address: | gwg7@sympatico.ca |
Click here for more information about our publications!
Comments
Date: 04/11/06Rank: 5Comment:

Request Information From Our Sponsors
- StockCharts.com, Inc.
- Candle Patterns
- Candlestick Charting Explained
- Intermarket Technical Analysis
- John Murphy on Chart Analysis
- John Murphy's Chart Pattern Recognition
- John Murphy's Market Message
- MurphyExplainsMarketAnalysis-Intermarket Analysis
- MurphyExplainsMarketAnalysis-Visual Analysis
- StockCharts.com
- Technical Analysis of the Financial Markets
- The Visual Investor
- VectorVest, Inc.
- Executive Premier Workshop
- One-Day Options Course
- OptionsPro
- Retirement Income Workshop
- Sure-Fire Trading Systems (VectorVest, Inc.)
- Trading as a Business Workshop
- VectorVest 7 EOD
- VectorVest 7 RealTime/IntraDay
- VectorVest AutoTester
- VectorVest Educational Services
- VectorVest OnLine
- VectorVest Options Analyzer
- VectorVest ProGraphics v6.0
- VectorVest ProTrader 7
- VectorVest RealTime Derby Tool
- VectorVest Simulator
- VectorVest Variator
- VectorVest Watchdog
