HOT TOPICS LIST
- MACD
- Fibonacci
- RSI
- Gann
- ADXR
- Stochastics
- Volume
- Triangles
- Futures
- Cycles
- Volatility
- ZIGZAG
- MESA
- Retracement
- Aroon
INDICATORS LIST
LIST OF TOPICS
PRINT THIS ARTICLE
by David Penn
Is the market's rejection of drug stocks hinting at an opportunity in growth stocks?
Position: N/A
David Penn
Technical Writer for Technical Analysis of STOCKS & COMMODITIES magazine, Working-Money.com, and Traders.com Advantage.
PRINT THIS ARTICLE
REVERSAL
Saying No To Drugs
04/11/06 08:15:09 AMby David Penn
Is the market's rejection of drug stocks hinting at an opportunity in growth stocks?
Position: N/A
| James Cramer, host of CNBC's most watchable program, Mad Money, is fond of pointing out that when it comes to Wall Street, "growth is like crack." And we're not talking about the kind that "breaks your momma's back," either. No, Cramer is referring to the capacity of companies to grow: grow their revenues, grow their earnings. Almost all else can be forgiven a company — poor Wall Street relations, insider selling, creative accounting — if that company can say that at the end of the day, it is bringing the Big G. |

|
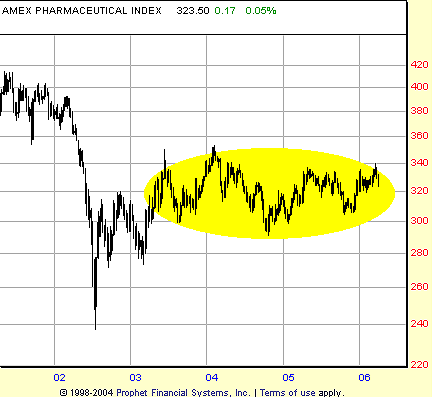
| FIGURE 1: AMEX PHARMACEUTICAL INDEX, WEEKLY. After rallying strongly from a mid-2002 bottom, pharmaceutical stocks have been range-bound since mid-2003. |
| Graphic provided by: Prophet Financial, Inc. |
| |
| There are a number of ways for speculators and investors to take this. One approach is to focus on not just those stocks and those sectors that are suspected of providing Growth. Of course, if it were that simple, then a stockpicker's work would last all of a few minutes. How do we know if we are in a stock environment that is conducive to Growth -- or, rather, to investor appreciation of Growth? After all, some companies report great growth and great earnings and still get clobbered by the market. Other companies warn of lackluster performance and minimal growth and are rewarded with buyers ignoring those facts. |
| One way to profit from the Growth theme is to look at those sectors that are Growth-agnostic. By "growth-agnostic," I am referring to those stocks and sectors whose fortunes are less tied to growth and more linked to stability and safety. While utilities stocks have historically performed this function, it is also true that pharmaceutical stocks have been chosen as a haven of sorts by many investors. True, there have been eras of growth that drug stocks have enjoyed over the past few decades. But increasingly, it is a combination of healthy dividends and a sense that the demand for life-saving/life-enhancing potions will at least remain constant over the next several years that are the major attractions for those looking to make purchases among the pharmaceutical stocks. |

|
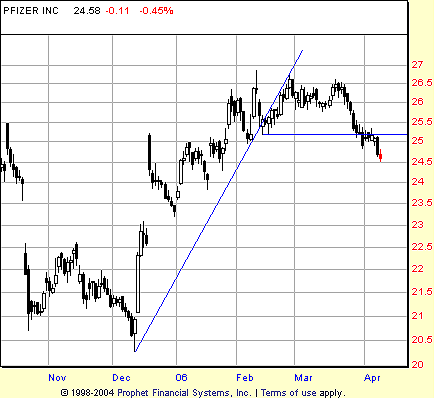
| FIGURE 2: PFIZER, DAILY. Shares of PFE look vulnerable to a classic 1-2-3 trend reversal as a trendline break in mid-February leads to a failed rally in March and a breakdown below the trendline break lows in early April. |
| Graphic provided by: Prophet Financial, Inc. |
| |
| As Figure 1 shows, pharmaceutical stocks have traded in a wide range for most of the past few years. At or near the 340 level (basis $DRG), these stocks have tended to find resistance, and at or near the 300 level, these stocks have tended to find support. Although it is a bit difficult to see in the weekly chart in Figure 1, drug stocks were once again approaching that upside resistance zone in the spring of 2006 -- a resistance zone that may just as well be appreciated by the chart of leading drug-maker Pfizer (PFE) shown in Figure 2. |
| PFE, as one might expect, ran into trouble at precisely the same time as the broader index of drug stocks ($DRG) indicated it might. For Pfizer, its meeting with sector-wide resistance appears to have arrived courtesy of a 1-2-3 trend reversal. The trend that is being reversed -- or that appears to be reversed -- is the one that connects the lows of December 2005 with the last low in early February before the high (which, incidentally, takes the form of a shooting star top) mere days later. This trend was broken a few days after the shooting star top. This initial, post-trendline break low, provided the (1) of the 1-2-3 trend reversal setup and a subsequent close below this level -- the (3) in the setup -- would be a signal that PFE was ready to head lower. The middle step -- the (2) in the setup -- refers to the attempt by bulls to push PFE higher after the initial break. That effort took place in late February and again just after mid-March (recall that a short-term bottom occurred in a number of stocks and sectors just before mid-March). This effort clearly appears to have failed, leading to the violation of the February lows by the end of March and going into April. |
Technical Writer for Technical Analysis of STOCKS & COMMODITIES magazine, Working-Money.com, and Traders.com Advantage.
| Title: | Technical Writer |
| Company: | Technical Analysis, Inc. |
| Address: | 4757 California Avenue SW |
| Seattle, WA 98116 | |
| Phone # for sales: | 206 938 0570 |
| Fax: | 206 938 1307 |
| Website: | www.Traders.com |
| E-mail address: | DPenn@traders.com |
Traders' Resource Links | |
| Charting the Stock Market: The Wyckoff Method -- Books | |
| Working-Money.com -- Online Trading Services | |
| Traders.com Advantage -- Online Trading Services | |
| Technical Analysis of Stocks & Commodities -- Publications and Newsletters | |
| Working Money, at Working-Money.com -- Publications and Newsletters | |
| Traders.com Advantage -- Publications and Newsletters | |
| Professional Traders Starter Kit -- Software | |
Click here for more information about our publications!
Comments
Date: 04/11/06Rank: 3Comment:
Date: 04/12/06Rank: 5Comment:

Request Information From Our Sponsors
- StockCharts.com, Inc.
- Candle Patterns
- Candlestick Charting Explained
- Intermarket Technical Analysis
- John Murphy on Chart Analysis
- John Murphy's Chart Pattern Recognition
- John Murphy's Market Message
- MurphyExplainsMarketAnalysis-Intermarket Analysis
- MurphyExplainsMarketAnalysis-Visual Analysis
- StockCharts.com
- Technical Analysis of the Financial Markets
- The Visual Investor
- VectorVest, Inc.
- Executive Premier Workshop
- One-Day Options Course
- OptionsPro
- Retirement Income Workshop
- Sure-Fire Trading Systems (VectorVest, Inc.)
- Trading as a Business Workshop
- VectorVest 7 EOD
- VectorVest 7 RealTime/IntraDay
- VectorVest AutoTester
- VectorVest Educational Services
- VectorVest OnLine
- VectorVest Options Analyzer
- VectorVest ProGraphics v6.0
- VectorVest ProTrader 7
- VectorVest RealTime Derby Tool
- VectorVest Simulator
- VectorVest Variator
- VectorVest Watchdog
