HOT TOPICS LIST
- MACD
- Fibonacci
- RSI
- Gann
- ADXR
- Stochastics
- Volume
- Triangles
- Futures
- Cycles
- Volatility
- ZIGZAG
- MESA
- Retracement
- Aroon
INDICATORS LIST
LIST OF TOPICS
PRINT THIS ARTICLE
by Paolo Pezzutti
This chart pattern provides reliable indications of a trend reversal. Here's an example.
Position: Sell
Paolo Pezzutti
Author of the book "Trading the US Markets - A Comprehensive Guide to US Markets for International Traders and Investors" - Harriman House (July 2008)
PRINT THIS ARTICLE
ISLAND REVERSAL
The Island Reversal Pattern: Research In Motion
04/10/06 08:39:58 AMby Paolo Pezzutti
This chart pattern provides reliable indications of a trend reversal. Here's an example.
Position: Sell
| An island top is formed when prices gap higher after an extended advance, trade one or more days leaving the gap open, then gap lower. Sometimes, after the upward exhaustion gap has formed, prices will trade in a range before gapping to the downside. Such a situation leaves the price action like an island, surrounded by space or water. The exhaustion gap to the upside followed by a breakaway gap to the downside completes the island reversal pattern and usually indicates a trend reversal. The significance of the pattern depends on where prices are in the general structure of the market action. The converse is true for island bottoms. The market can trade for several sessions before the second gap in the opposite direction forms. False signals are common and you might want to wait and see if the second gap gets filled. This will reduce your risk, of course, but also the profit opportunity. It is the usual tradeoff between risk and reward, which must be analyzed when making decisions, according to the trading style adopted. |

|
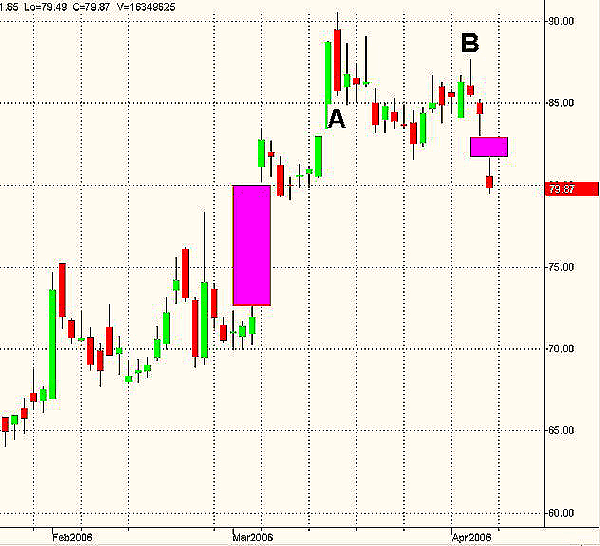
| FIGURE 1: RIMM. The two gaps on the daily chart form an island reversal top. The first box shows an up gap after a rally. The second box displays a down gap about a month later. This combination of gaps usually signals a top. |
| Graphic provided by: TradeStation. |
| |
| Let's look at an example now. Research in Motion (RIMM) designs, manufactures, and markets innovative wireless solutions for the mobile communications market. On March 6, just days before a judge was expected to issue an injunction shutting down the company's popular email service, the patent holder, NTP, dropped its infringement lawsuit against the device maker in exchange for $612.5 million. The announcement followed three days of negotiations as well as several setbacks for NTP at the US Patent and Trademark Office. Research in Motion's decision to settle was immediately welcomed by customers and investors; its shares rose as much as 19%, to $85.40, in after-hours trading, to open at about $81 the next morning. In Figure 1, the first gap forms the island reversal pattern. It is an exhaustion gap. Prices continued at a fast pace to the upside for a few days, when on March 16, a long black candle printed a top for the stock with a high above $90 (point A). The pattern is a dark cloud cover. It is a two-candlestick pattern that is a top reversal after an uptrend or, at times, at the top of a congestion band. The first day of this two-candlestick pattern is a strong white real body. The second day's price opens above the prior session's high (that is, above the top of the upper shadow). However, by the end of the second day's session, the market closes near the low of the day and well within the prior day's white body. The greater the degree of penetration into the white real body, the more likely a top will occur. The next indication of weakness was printed on April 5, when prices rallied to the upside, only to close negatively for the day (point B). On Friday, prices gapped to the downside on news that strong job creation and a jobless rate was at a five-year low, stoking high-rate fears. Last Friday's gap, a breakaway gap, completed the island reversal pattern. Now, we should expect to see weakness in the short and intermediate term for the stock, unless this second gap is filled soon. |
Author of the book "Trading the US Markets - A Comprehensive Guide to US Markets for International Traders and Investors" - Harriman House (July 2008)
| Address: | VIA ROBERTO AGO 26 POSTAL CODE 00166 |
| Rome, ITALY | |
| Phone # for sales: | +393357540708 |
| E-mail address: | pezzutti.paolo@tiscali.it |
Click here for more information about our publications!
Comments
Date: 04/10/06Rank: 3Comment:

|

Request Information From Our Sponsors
- StockCharts.com, Inc.
- Candle Patterns
- Candlestick Charting Explained
- Intermarket Technical Analysis
- John Murphy on Chart Analysis
- John Murphy's Chart Pattern Recognition
- John Murphy's Market Message
- MurphyExplainsMarketAnalysis-Intermarket Analysis
- MurphyExplainsMarketAnalysis-Visual Analysis
- StockCharts.com
- Technical Analysis of the Financial Markets
- The Visual Investor
- VectorVest, Inc.
- Executive Premier Workshop
- One-Day Options Course
- OptionsPro
- Retirement Income Workshop
- Sure-Fire Trading Systems (VectorVest, Inc.)
- Trading as a Business Workshop
- VectorVest 7 EOD
- VectorVest 7 RealTime/IntraDay
- VectorVest AutoTester
- VectorVest Educational Services
- VectorVest OnLine
- VectorVest Options Analyzer
- VectorVest ProGraphics v6.0
- VectorVest ProTrader 7
- VectorVest RealTime Derby Tool
- VectorVest Simulator
- VectorVest Variator
- VectorVest Watchdog
