HOT TOPICS LIST
- MACD
- Fibonacci
- RSI
- Gann
- ADXR
- Stochastics
- Volume
- Triangles
- Futures
- Cycles
- Volatility
- ZIGZAG
- MESA
- Retracement
- Aroon
INDICATORS LIST
LIST OF TOPICS
PRINT THIS ARTICLE
by Gary Grosschadl
Sysco Corp. has been on a downtrend since slipping below its 200-day exponential moving average last August.
Position: Hold
Gary Grosschadl
Independent Canadian equities trader and technical analyst based in Peterborough
Ontario, Canada.
PRINT THIS ARTICLE
CHART ANALYSIS
Sysco Corp. Marks A Bottom On Its Daily Chart
04/11/06 08:09:58 AMby Gary Grosschadl
Sysco Corp. has been on a downtrend since slipping below its 200-day exponential moving average last August.
Position: Hold
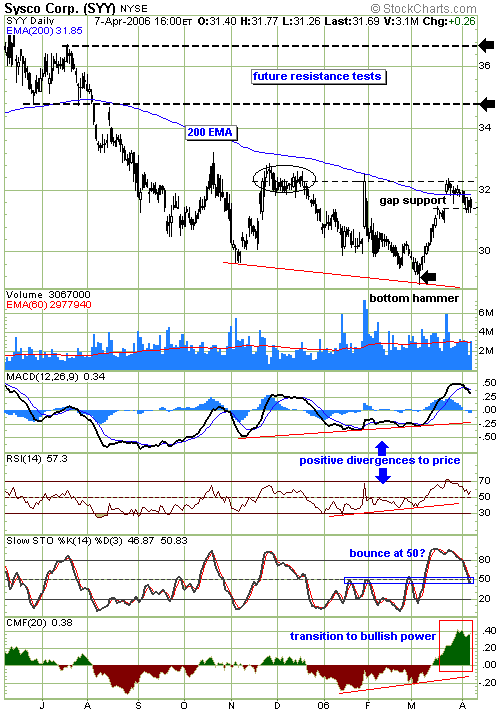
| The hammer candlestick from early March suggests a bottom may be in with some collaborating evidence for this food-service marketer and distributor. Note the multiple positive divergences to price action in the graphs below Figure 1 via the moving average convergence/divergence (MACD), the relative strength index (RSI), and the Chaikin money flow (CMF). This combination of a candlestick reversal pattern and positive divergences is often a reliable signal of an uptrend under way. |
| Since the 200-day EMA marked the downtrend last August, it should be no surprise that it's also a factor in this bottom attempt. This level has added significance as it also relates to a previous congestion area from last December. Note the gap support area that may hold the current retracement to this level. A move back above the 200-day EMA would be bullish as this support level could be the launchpad for the next upleg. |

|
| FIGURE 1: SYSCO, DAILY. SYY shows an upleg off a bottom hammer. |
| Graphic provided by: StockCharts.com. |
| |
| The Chaikin money flow indicator looks particularily bullish as this supply/demand indicator shows bullish power much more robust than in previous upthrusts. This was preceded by a positive divergence to price action. The RSI graph is hinting at a turn at its often key 50 area while the stochastics oscillator is at its 50 level. Less promising is the MACD showing a bearish cross of its signal line; this indicator, however, is less sensitive than the other two to early turns. |
| In the short term, two upside tests are outlined at 34.80 and 36.80. These could reverse or pause the next upleg. The downside risk is that gap support could fail at this current level near 31.20. A close under this level pulls all bullish bets as stop-losses could be triggered here. |
Independent Canadian equities trader and technical analyst based in Peterborough
Ontario, Canada.
| Website: | www.whatsonsale.ca/financial.html |
| E-mail address: | gwg7@sympatico.ca |
Click here for more information about our publications!
PRINT THIS ARTICLE

Request Information From Our Sponsors
- VectorVest, Inc.
- Executive Premier Workshop
- One-Day Options Course
- OptionsPro
- Retirement Income Workshop
- Sure-Fire Trading Systems (VectorVest, Inc.)
- Trading as a Business Workshop
- VectorVest 7 EOD
- VectorVest 7 RealTime/IntraDay
- VectorVest AutoTester
- VectorVest Educational Services
- VectorVest OnLine
- VectorVest Options Analyzer
- VectorVest ProGraphics v6.0
- VectorVest ProTrader 7
- VectorVest RealTime Derby Tool
- VectorVest Simulator
- VectorVest Variator
- VectorVest Watchdog
- StockCharts.com, Inc.
- Candle Patterns
- Candlestick Charting Explained
- Intermarket Technical Analysis
- John Murphy on Chart Analysis
- John Murphy's Chart Pattern Recognition
- John Murphy's Market Message
- MurphyExplainsMarketAnalysis-Intermarket Analysis
- MurphyExplainsMarketAnalysis-Visual Analysis
- StockCharts.com
- Technical Analysis of the Financial Markets
- The Visual Investor
