HOT TOPICS LIST
- MACD
- Fibonacci
- RSI
- Gann
- ADXR
- Stochastics
- Volume
- Triangles
- Futures
- Cycles
- Volatility
- ZIGZAG
- MESA
- Retracement
- Aroon
INDICATORS LIST
LIST OF TOPICS
PRINT THIS ARTICLE
by Arthur Hill
Radio Shack remains in a downtrend, but managed to firm immediately after a big gap -- which may turn into an exhaustion gap.
Position: Hold
Arthur Hill
Arthur Hill is currently editor of TDTrader.com, a website specializing in trading strategies, sector/industry specific breadth stats and overall technical analysis. He passed the Society of Technical Analysts (STA London) diploma exam with distinction is a Certified Financial Technician (CFTe). Prior to TD Trader, he was the Chief Technical Analyst for Stockcharts.com and the main contributor to the ChartSchool.
PRINT THIS ARTICLE
EXHAUSTION GAP
An Exhaustion Gap For Radio Shack?
04/07/06 09:32:56 AMby Arthur Hill
Radio Shack remains in a downtrend, but managed to firm immediately after a big gap -- which may turn into an exhaustion gap.
Position: Hold
| Despite a nice rally in the major indexes this year, Radio Shack (RSH) remains down in the dumps and recorded a new 52-week low in early April. The stock is underperforming the broader market and the April gap down only adds insult to injury. |

|
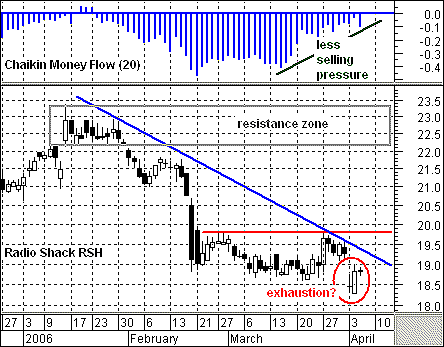
| FIGURE 1: RADIO SHACK. Quickly after a gap down, RSH managed to firm and form a doji on the day (red oval). |
| Graphic provided by: MetaStock. |
| |
| Despite this gap down, the stock managed to immediately firm and form a doji on the day (red circle, Figure 1). A doji forms when the open and close are relatively equal. It looks a bit like a cross (+) and signals sudden indecision. In this case, buyers were not deterred by the gap, and this is positive. The stock opened lower the next day, but managed to move higher by the close and form a modest white candlestick. This also shows buying pressure and reinforces support around 18.5. |
| Firmness is one thing, however, and a rebound is another. The stock established resistance just below 20 over the last five to six weeks. It would take a move above 20 to fill the gap, break the blue trendline, and exceed resistance. This would make the gap an exhaustion gap, and such resilience would be short-term bullish. The first upside target would be resistance around 23 from the January highs (gray rectangle). |
| The Chaikin money flow shows that selling pressure is easing but has yet to turn into actual buying pressure. This indicator is based on the relationship of the close relative to the high-low range. Closes above the midpoint of the range imply positive money flow (volume), and closes below the midpoint imply negative money flow. Unlike on-balance volume, this indicator is not concerned with the price change from close to close, but rather the price action on that given day. The Chaikin money flow moved below -40% in February and March. With the decline over the last seven days, the indicator has remained around -10%. It is still negative, and traders should watch for a break into positive territory to confirm a breakout in the stock. |
Arthur Hill is currently editor of TDTrader.com, a website specializing in trading strategies, sector/industry specific breadth stats and overall technical analysis. He passed the Society of Technical Analysts (STA London) diploma exam with distinction is a Certified Financial Technician (CFTe). Prior to TD Trader, he was the Chief Technical Analyst for Stockcharts.com and the main contributor to the ChartSchool.
| Title: | Editor |
| Company: | TDTrader.com |
| Address: | Willem Geetsstraat 17 |
| Mechelen, B2800 | |
| Phone # for sales: | 3215345465 |
| Website: | www.tdtrader.com |
| E-mail address: | arthurh@tdtrader.com |
Traders' Resource Links | |
| TDTrader.com has not added any product or service information to TRADERS' RESOURCE. | |
Click here for more information about our publications!
Comments
Date: 04/07/06Rank: 5Comment:

|

Request Information From Our Sponsors
- StockCharts.com, Inc.
- Candle Patterns
- Candlestick Charting Explained
- Intermarket Technical Analysis
- John Murphy on Chart Analysis
- John Murphy's Chart Pattern Recognition
- John Murphy's Market Message
- MurphyExplainsMarketAnalysis-Intermarket Analysis
- MurphyExplainsMarketAnalysis-Visual Analysis
- StockCharts.com
- Technical Analysis of the Financial Markets
- The Visual Investor
- VectorVest, Inc.
- Executive Premier Workshop
- One-Day Options Course
- OptionsPro
- Retirement Income Workshop
- Sure-Fire Trading Systems (VectorVest, Inc.)
- Trading as a Business Workshop
- VectorVest 7 EOD
- VectorVest 7 RealTime/IntraDay
- VectorVest AutoTester
- VectorVest Educational Services
- VectorVest OnLine
- VectorVest Options Analyzer
- VectorVest ProGraphics v6.0
- VectorVest ProTrader 7
- VectorVest RealTime Derby Tool
- VectorVest Simulator
- VectorVest Variator
- VectorVest Watchdog
