HOT TOPICS LIST
- MACD
- Fibonacci
- RSI
- Gann
- ADXR
- Stochastics
- Volume
- Triangles
- Futures
- Cycles
- Volatility
- ZIGZAG
- MESA
- Retracement
- Aroon
INDICATORS LIST
LIST OF TOPICS
PRINT THIS ARTICLE
by Alexander Nikolov
In an uptrend, once a resistance level is broken, it should turn into support.
Position: N/A
Alexander Nikolov
Alexander Nikolov is the chief technical analyst and head of International Capital Markets Department at Karoll - Finance House (www.karoll.net) - a leading Bulgarian brokerage firm. His experience includes coverage of the US stock market, East European markets, and major currencies.
PRINT THIS ARTICLE
SUPPORT & RESISTANCE
NASDAQ Composite Breaks Above MT Resistance
04/06/06 09:13:21 AMby Alexander Nikolov
In an uptrend, once a resistance level is broken, it should turn into support.
Position: N/A
| Recently, the NASDAQ Composite broke above its January 2006 top at 2333 and has stayed above that level ever since. Most Elliott wave analysts have had difficulties in labeling the advance since the March 2003 low because this advance has remained a corrective move. Nevertheless, looking at the chart resistance and support levels (a rather simple approach), combined with some technical indicators, allows us to make a good guess of where we are in the advance from the 2003 low. |

|
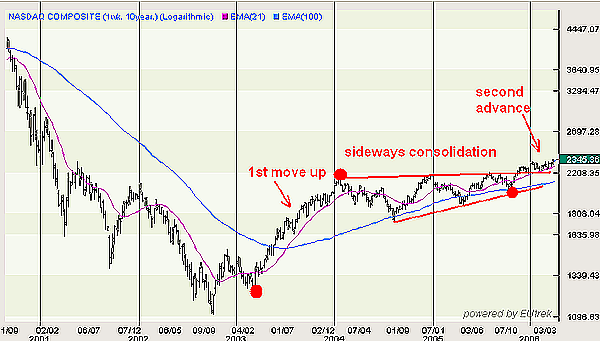
| FIGURE 1: NASDAQ COMPOSITE, WEEKLY. The rise from the October 2005 low is likely to be the second advance from the March 2003 low. |
| Graphic provided by: www.EUtrek.com. |
| |
| As it can be seen from Figure 1, the initial rise from the March 2003 low stayed above the 21-week and 100-week exponential moving averages (EMAs) until it was over. Then, despite the several rally attempts in 2004 and most of 2005, the entire price action developed into a running triangle. This view is supported by the fact that the price crossed the 21-week and 100-week EMAs several times. Thus, the correct interpretation of the chart (and interpretation from the Elliott wave point of view) is to consider the entire price action from January 2004 top to October 2005 low as one move — namely, a running triangle. The advance from the 2025 low (October 2005) has not been spectacular so far. However, it has moved the prices higher, and the attempts on the downside earlier this year have found good support exactly where needed. |

|
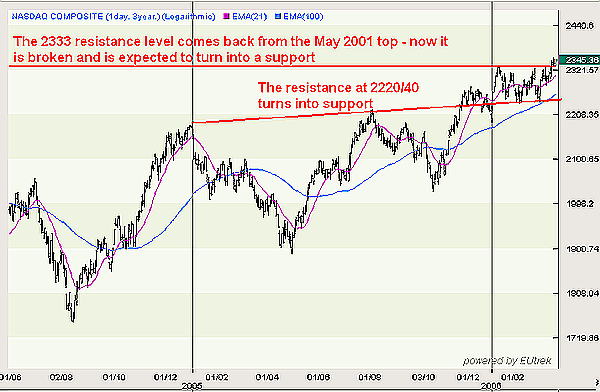
| FIGURE 2: NASDAQ COMPOSITE, DAILY. The resistance 2220/40 has turned into support, and now, the market is above the next formidable level at 2333. |
| Graphic provided by: www.EUtrek.com. |
| |
| As it can be seen from Figure 2, the short-term declines in January, February, and March this year have stayed above the 2240/20 support zone (previous resistance). At the same time, the rally attempts in first-quarter 2006 have found strong resistance into the 2327/33 level (this level comes back from the May 2001 top!). Finally, few days ago, the NASDAQ Composite index broke above that important chart level and has stayed above it ever since. As long as the index stays above that level, both the short-term and medium-term trend should be considered upward and strong gains are likely in the next several months. The next MT upside target comes at 2857 (61.8% pullback of the 5132-1108 fall on the log price scale as well as 4.236 external projection of the 1108-1521 rise measured on the linear price scale). |
| What will destroy this bullish outlook? The first sign that a ST top is in place will come with a firm break below the critical 2333/27 support. However, a break below the previous resistance at 2240/20 now turned into support is required to confirm a MT top is in place and to bring the much-awaited deeper retracement of the entire rally from the March 2005 low. |
Alexander Nikolov is the chief technical analyst and head of International Capital Markets Department at Karoll - Finance House (www.karoll.net) - a leading Bulgarian brokerage firm. His experience includes coverage of the US stock market, East European markets, and major currencies.
| Title: | Head of Department |
| Company: | Karoll |
| Phone # for sales: | 0035929811381 |
| Website: | www.karoll.net |
| E-mail address: | anikolov@karoll.net |
Traders' Resource Links | |
| Karoll has not added any product or service information to TRADERS' RESOURCE. | |
Click here for more information about our publications!
Comments
Date: 04/06/06Rank: 3Comment:

|

Request Information From Our Sponsors
- StockCharts.com, Inc.
- Candle Patterns
- Candlestick Charting Explained
- Intermarket Technical Analysis
- John Murphy on Chart Analysis
- John Murphy's Chart Pattern Recognition
- John Murphy's Market Message
- MurphyExplainsMarketAnalysis-Intermarket Analysis
- MurphyExplainsMarketAnalysis-Visual Analysis
- StockCharts.com
- Technical Analysis of the Financial Markets
- The Visual Investor
- VectorVest, Inc.
- Executive Premier Workshop
- One-Day Options Course
- OptionsPro
- Retirement Income Workshop
- Sure-Fire Trading Systems (VectorVest, Inc.)
- Trading as a Business Workshop
- VectorVest 7 EOD
- VectorVest 7 RealTime/IntraDay
- VectorVest AutoTester
- VectorVest Educational Services
- VectorVest OnLine
- VectorVest Options Analyzer
- VectorVest ProGraphics v6.0
- VectorVest ProTrader 7
- VectorVest RealTime Derby Tool
- VectorVest Simulator
- VectorVest Variator
- VectorVest Watchdog
