HOT TOPICS LIST
- MACD
- Fibonacci
- RSI
- Gann
- ADXR
- Stochastics
- Volume
- Triangles
- Futures
- Cycles
- Volatility
- ZIGZAG
- MESA
- Retracement
- Aroon
INDICATORS LIST
LIST OF TOPICS
PRINT THIS ARTICLE
by David Penn
The symmetrical triangle in continuous crude oil futures is well worth watching.
Position: N/A
David Penn
Technical Writer for Technical Analysis of STOCKS & COMMODITIES magazine, Working-Money.com, and Traders.com Advantage.
PRINT THIS ARTICLE
TRIANGLES
Crude Oil's Triangle-In-Progress
04/06/06 08:57:04 AMby David Penn
The symmetrical triangle in continuous crude oil futures is well worth watching.
Position: N/A
| In a recent article for Traders.com Advantage, I spoke about the case for short-term weakness in crude oil leading to a resumption of longer-term strength ("How Low Can Crude Go?" March 10, 2006). The vehicle of this short-term weakness, I believed, was a bearish flag that had developed over the course of the second half of February in June crude oil futures. Although that bearish flag proved to be an incorrect call on my part, I warned then as I have in other previous articles on crude oil (see also my "Crude Comes In [Again]," February 7, 2006; and "Is Crude Oil Ready to Run?" October 18, 2005): Crude oil is in the early stages of a secular bull market that began in earliest 1999 and is likely to move higher than most casual observers expect. |

|
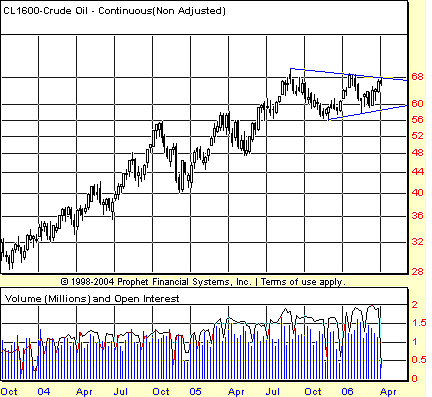
| FIGURE 1: CRUDE OIL, CONTINUOUS FUTURES, WEEKLY. Still too early to call, this symmetrical triangle-in-progress will need to find resistance at the upper triangle boundary and, if the breakout is to be upward, support at the lower triangle boundary before meaningful moves can take place. |
| Graphic provided by: Prophet Financial, Inc. |
| |
The vehicle of this "move higher than most casual observers expect" increasingly appears to be a symmetrical triangle. This triangle, shown in the weekly chart of continuous crude oil futures in Figure 1, currently has four confirming touches: the first in the middle of the fourth quarter of 2005, the second early in the first quarter of 2006, the third in the middle of the first quarter of 2006, and the fourth in the latest days of the first quarter of 2006. These are already enough touches to confirm the triangle. As Thomas Bulkowski wrote in the second edition of his book, Encyclopedia Of Chart Patterns:There should be at least two distinct minor highs and two minor lows that touch the trendlines (in other words, at least four trend reversals). |
| By "confirm the triangle," I mean that a valid triangle consolidation/pattern has developed. That doesn't necessarily mean that the triangle will remain valid until a breakout occurs. The price range shown in Figure 1 could expand, turning what is currently a symmetrical triangle into a rectangle or some other form of consolidation. But for present analytical purposes, the narrowing/converging trendlines and the four touches by crude oil beginning in fourth-quarter 2005 allow us to treat the formation as a triangle in terms of what the consolidation (or, more accurately, a break from it) will mean for the markets. |

|
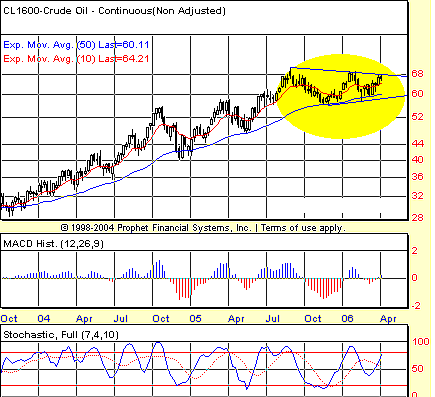
| FIGURE 2: CRUDE OIL, CONTINUOUS FUTURES, WEEKLY. Note how crude oil manages to repeatedly find support on the back of the 50-week EMA. As long as this moving average is a source of support, the likelihood that any breakout from the triangle will be upward is increased. |
| Graphic provided by: Prophet Financial, Inc. |
| |
| The most striking aspect of crude oil — from the perspective of the chart in Figure 2 — is how the market never closed below the 50-week exponential moving average (EMA) two weeks in a row over this period. In fact, you'd have to go back to the early autumn of 2003 to find two consecutive weeks during which crude oil (basis continuous futures) closed below the 50-week EMA. This is a sign of true strength in the trend — and true panic over the price of crude oil. It is also probably worth noting how gingerly crude oil tested the lower boundary of the triangle on its third touch (the middle of first-quarter 2006). The triangle notwithstanding, that kind of long lower shadow generally suggests buying strength as the market attempted to move lower. As such, it underscores the 58 level as a potential source of support — which may become important if the market reverses at the upper boundary and begins to move back downward. |
| What could investors and speculators expect should the crude oil market break free from this symmetrical triangle and move higher? From current levels, a move downward to test the lower boundary (and the 58 level) seems like a likely move, followed by a surge upward toward the upper boundary. Given the fact that the triangle is nearly 15 points wide at its widest point, and a likely breakout level is at about 66, an initial breakout and minimum upside advance to the 81 area may be a bet worth making, particularly if oil stocks continue to show strength. |
Technical Writer for Technical Analysis of STOCKS & COMMODITIES magazine, Working-Money.com, and Traders.com Advantage.
| Title: | Technical Writer |
| Company: | Technical Analysis, Inc. |
| Address: | 4757 California Avenue SW |
| Seattle, WA 98116 | |
| Phone # for sales: | 206 938 0570 |
| Fax: | 206 938 1307 |
| Website: | www.Traders.com |
| E-mail address: | DPenn@traders.com |
Traders' Resource Links | |
| Charting the Stock Market: The Wyckoff Method -- Books | |
| Working-Money.com -- Online Trading Services | |
| Traders.com Advantage -- Online Trading Services | |
| Technical Analysis of Stocks & Commodities -- Publications and Newsletters | |
| Working Money, at Working-Money.com -- Publications and Newsletters | |
| Traders.com Advantage -- Publications and Newsletters | |
| Professional Traders Starter Kit -- Software | |
Click here for more information about our publications!
Comments
Date: 04/06/06Rank: 3Comment:

Request Information From Our Sponsors
- VectorVest, Inc.
- Executive Premier Workshop
- One-Day Options Course
- OptionsPro
- Retirement Income Workshop
- Sure-Fire Trading Systems (VectorVest, Inc.)
- Trading as a Business Workshop
- VectorVest 7 EOD
- VectorVest 7 RealTime/IntraDay
- VectorVest AutoTester
- VectorVest Educational Services
- VectorVest OnLine
- VectorVest Options Analyzer
- VectorVest ProGraphics v6.0
- VectorVest ProTrader 7
- VectorVest RealTime Derby Tool
- VectorVest Simulator
- VectorVest Variator
- VectorVest Watchdog
- StockCharts.com, Inc.
- Candle Patterns
- Candlestick Charting Explained
- Intermarket Technical Analysis
- John Murphy on Chart Analysis
- John Murphy's Chart Pattern Recognition
- John Murphy's Market Message
- MurphyExplainsMarketAnalysis-Intermarket Analysis
- MurphyExplainsMarketAnalysis-Visual Analysis
- StockCharts.com
- Technical Analysis of the Financial Markets
- The Visual Investor
