HOT TOPICS LIST
- MACD
- Fibonacci
- RSI
- Gann
- ADXR
- Stochastics
- Volume
- Triangles
- Futures
- Cycles
- Volatility
- ZIGZAG
- MESA
- Retracement
- Aroon
INDICATORS LIST
LIST OF TOPICS
PRINT THIS ARTICLE
by Koos van der Merwe
In a turnaround, in today's world, it is India and China that are "colonizing" the West — but they are doing so financially.
Position: Accumulate
Koos van der Merwe
Has been a technical analyst since 1969, and has worked as a futures and options trader with First Financial Futures in Johannesburg, South Africa.
PRINT THIS ARTICLE
ELLIOTT WAVE
Is The East Colonizing The West?
04/06/06 08:36:41 AMby Koos van der Merwe
In a turnaround, in today's world, it is India and China that are "colonizing" the West — but they are doing so financially.
Position: Accumulate
| ICICI Bank is India's second-largest bank, with total assets of about US$38.5 billion as of March 31, 2005, with a profit after taxes of US$461 million for the year ended March 31, 2005, and US$376 million in fiscal 2004. ICICI Bank has a network of about 573 branches and extension counters and more than 2,000 automated teller machines (ATMs). The bank offers a range of banking products and financial services to corporate and retail customers through a variety of delivery channels. ICICI Bank set up its international banking group in fiscal 2002 to cater to the cross-border needs of clients. Currently, it has subsidiaries in the United Kingdom, Canada, and Russia, with branches in Singapore and Bahrain and representative offices in the United States, China, United Arab Emirates, Bangladesh, and South Africa. Its shares are listed in India on the Bombay Stock Exchange and the National Stock Exchange of India Ltd., and its American Depositary Receipts (ADRs) are listed on the New York Stock Exchange (NYSE). |

|
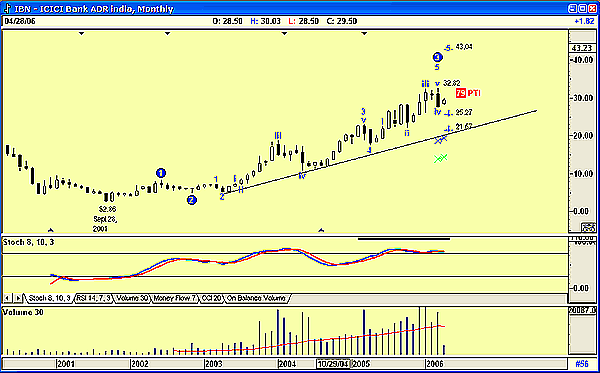
| FIGURE 1: ICICI BANK, MONTHLY. In September 2001, this stock was trading at $2.86, and it has reached a high of $32.82 in what appears to be a third-wave top. |
| Graphic provided by: AdvancedGET. |
| |
| A look at the monthly chart (Figure 1) shows why the stock came to my attention. In September 2001, the share was trading at $2.86 and has now reached a high of $32.82 in what appears to be a third wave top. The share price, according to the chart, should now fall in a fourth wave to a low at either $25.27 or $21.27. The profit taking indicator (PTI) suggests a 79% probability for this to occur, followed by a rise into the fifth wave target. We would therefore wait for the fourth wave to be completed before buying. The stochastic indicator confirms that the price should correct downward. The PTI usually applies to the probability of the target for a fifth wave top be reached. Over the years, I have been inclined to look at it as a percentage, with anything below 32% as being a negative probability. |

|
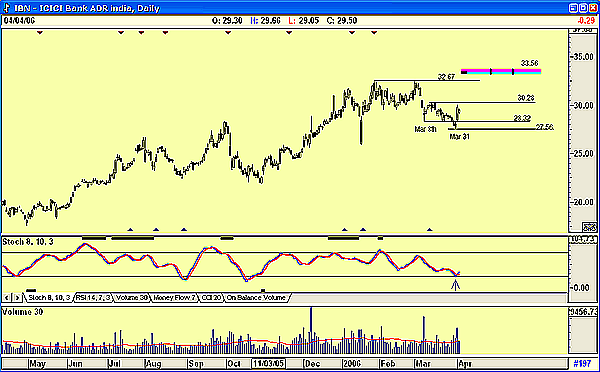
| FIGURE 2: ICICI BANK, DAILY. This stock made a low on March 8, followed by a lower low on March 31. The retracement should now rise above the high reached between the two lows, $30.28. |
| Graphic provided by: AdvancedGET. |
| |
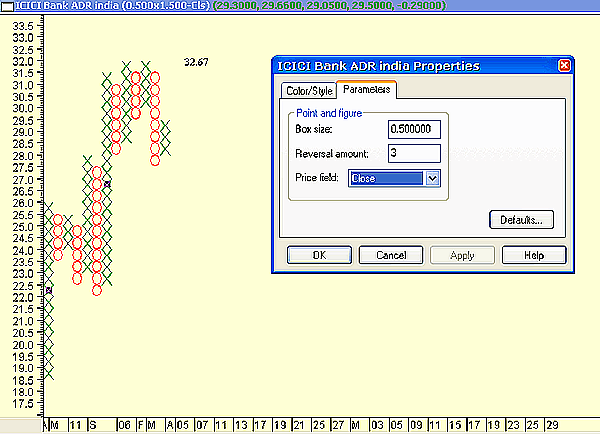
| The daily chart (Figure 2) shows that the price made a low on March 8, followed by a lower low on March 31. The retracement should now rise above the high reached between the two lows — $30.28 — before we could buy the stock for the short term. The stochastic oscillator is oversold, and appears to be giving a buy signal. Volume is also below average, suggesting that selling is drying up — a positive sign. The double top at $32.67 acts as a deterrent, but a move above the $32.67 level will see a very strong rise to a possible target of $41.67. This is suggested by the point & figure chart shown in Figure 3. |

|
| FIGURE 3: ICICI POINT & FIGURE. This P&F suggests a strong rise to a possible target of $41.67. |
| Graphic provided by: MetaStock. |
| |
| A horizontal count shows six columns multiplied by parameters 0.5 = 9, added to 32.67 = $41.67. The P&F chart suggests that the price should break above the $32.67 level before we buy the stock. This would be a conservative strategy to follow. Those with a greater risk profile could buy once the price breaks above $30.28. This stock should be placed on your watchlist for a future buy and long-term hold. |
Has been a technical analyst since 1969, and has worked as a futures and options trader with First Financial Futures in Johannesburg, South Africa.
| Address: | 3256 West 24th Ave |
| Vancouver, BC | |
| Phone # for sales: | 6042634214 |
| E-mail address: | petroosp@gmail.com |
Click here for more information about our publications!
Comments
Date: 04/06/06Rank: 3Comment:

Request Information From Our Sponsors
- StockCharts.com, Inc.
- Candle Patterns
- Candlestick Charting Explained
- Intermarket Technical Analysis
- John Murphy on Chart Analysis
- John Murphy's Chart Pattern Recognition
- John Murphy's Market Message
- MurphyExplainsMarketAnalysis-Intermarket Analysis
- MurphyExplainsMarketAnalysis-Visual Analysis
- StockCharts.com
- Technical Analysis of the Financial Markets
- The Visual Investor
- VectorVest, Inc.
- Executive Premier Workshop
- One-Day Options Course
- OptionsPro
- Retirement Income Workshop
- Sure-Fire Trading Systems (VectorVest, Inc.)
- Trading as a Business Workshop
- VectorVest 7 EOD
- VectorVest 7 RealTime/IntraDay
- VectorVest AutoTester
- VectorVest Educational Services
- VectorVest OnLine
- VectorVest Options Analyzer
- VectorVest ProGraphics v6.0
- VectorVest ProTrader 7
- VectorVest RealTime Derby Tool
- VectorVest Simulator
- VectorVest Variator
- VectorVest Watchdog
