HOT TOPICS LIST
- MACD
- Fibonacci
- RSI
- Gann
- ADXR
- Stochastics
- Volume
- Triangles
- Futures
- Cycles
- Volatility
- ZIGZAG
- MESA
- Retracement
- Aroon
INDICATORS LIST
LIST OF TOPICS
PRINT THIS ARTICLE
by David Penn
The last tempting triangle prepared Dow investors for a 386-point ride. Now an ascending triangle in the weekly S&P 500 suggests more upside.
Position: N/A
David Penn
Technical Writer for Technical Analysis of STOCKS & COMMODITIES magazine, Working-Money.com, and Traders.com Advantage.
PRINT THIS ARTICLE
TRIANGLES
The Return Of Tempting Triangles
04/04/06 11:39:33 AMby David Penn
The last tempting triangle prepared Dow investors for a 386-point ride. Now an ascending triangle in the weekly S&P 500 suggests more upside.
Position: N/A
| Back in mid-February, I alerted readers to the possibility of a significant upside move in the Dow Jones industrials ("The Dow's Tempting Triangle," Traders.com Advantage, February 14, 2006). The date that article was published, the Dow 30 had just broken free from a symmetrical triangle that suggested a minimum move to as high as 11266. I followed that article up with another, "Triangle Target" (March 27, 2006), which highlighted both the mid-move pullback to the breakout level and the resistance the Dow 30 ran into when it reached its minimum price objective. A recent review of the weekly indexes turned up another triangle, this time an ascending one, of which traders should be no less aware. This triangle appeared in the weekly chart of the Standard & Poor's 500 and, as I hinted in another recent article on the S&P 500 ("Holding The Breakout," March 30, 2006), appears to point to further upside for stocks. |

|
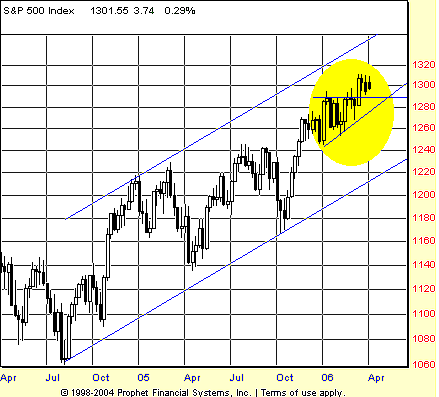
| FIGURE 1: S&P 500, WEEKLY. This ascending triangle over the course of the first quarter of 2006 developed in the middle of the trend channel that extends from the lows of 2004. A minimum price objective of 1335 means that any triangle breakout may test, but will probably not break out, above the upper boundary of the channel. |
| Graphic provided by: Prophet Financial, Inc. |
| |
| The ascending triangle shown in Figure 1 is really no less apparent in the daily chart (Figure 2). But weekly charts often provide a sort of perspective that can be too easily overlooked in the "Sturm und Drang" of everyday market activity. Most important of these "easily overlooked" facts is the reality that the S&P 500 is in a bull market — and has been since the lows of 2004. There were two serious correction lows — one early in the second quarter of 2005, and another early in the fourth quarter of 2005. These were serious corrections because they did take out previous minor correction lows (the fourth-quarter 2005 correction took out two of such lows), but they remained corrections rather than reversals in part because the fourth-quarter correction was still a higher low relative to the second-quarter correction. |
| Returning to the ascending triangle, we can see that it appears as if the $SPX prematurely broke free from the triangle and in recent weeks has been in the process of pulling back from those excesses. I say "prematurely" because healthy breakouts from ascending triangles tend to come when prices have moved about two-thirds of the way along the patterns. The example in Figure 1 shows a breakout that occurs closer to halfway through the pattern — hence the pullback. Those speculators and investors consulting weekly charts should keep a close watch on the breakout level of, roughly, 1290, insofar as that level now represents the kind of support that could provide for launching the S&P 500 toward the mid-1300s. |

|
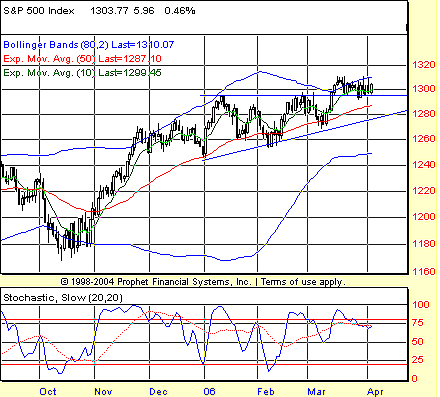
| FIGURE 2: S&P 500, DAILY. The initial breakout from the ascending triangle in the S&P 500 came just as the Bollinger Bands tightened, reflecting the contraction in volatility as the triangle consolidation developed. |
| Graphic provided by: Prophet Financial, Inc. |
| |
| In the same way that traders often consult hourly charts in an effort to divine outcomes in daily charts, speculators and investors can sometimes use daily charts to help ferret out details and clues hard to discern in weekly charts. For example, Figure 2 features my BOSO screen of an extra-long Bollinger Band and a 20/20 stochastic (for more on the BOSO screen, which is derived from the work of Price Headley of BigTrends.com, see my Working-Money.com article "BOSO," October 5, 2005). What we can see on the BOSO screen is that the S&P 500 has experienced a number of stochastic breakouts in 2006, but none of them have managed to remain overbought (the "sweet spot" in the BOSO approach). Nevertheless, those watching the S&P 500 should be alert to the next time the S&P 500 does in fact make a stochastic breakout (that is, becomes "overbought") because any meaningful move higher (such as from an ascending triangle breakout) will almost assuredly be accompanied by a stochastic breakout on the daily charts. |
| I mentioned in passing the possibility of the S&P 500 reaching the mid-1300s. To be more specific, the height of the ascending triangle is approximately 45 points (1290-1245). Adding the height of the pattern to the value at the top of the pattern provides for a minimum upside target of 1335. Insofar as the Dow 30 exceeded the minimum upside projection from its triangle by some 90-odd points (more if the industrials confirm the transports with a new high — see my "Transports Take The Lead, Again," April 4, 2006), it seems reasonable to suspect that the S&P 500 might exceed its minimum upside projection by a comparable 18-20 S&P points. * All articles mentioned are from Traders.com Advantage unless otherwise noted. |
Technical Writer for Technical Analysis of STOCKS & COMMODITIES magazine, Working-Money.com, and Traders.com Advantage.
| Title: | Technical Writer |
| Company: | Technical Analysis, Inc. |
| Address: | 4757 California Avenue SW |
| Seattle, WA 98116 | |
| Phone # for sales: | 206 938 0570 |
| Fax: | 206 938 1307 |
| Website: | www.Traders.com |
| E-mail address: | DPenn@traders.com |
Traders' Resource Links | |
| Charting the Stock Market: The Wyckoff Method -- Books | |
| Working-Money.com -- Online Trading Services | |
| Traders.com Advantage -- Online Trading Services | |
| Technical Analysis of Stocks & Commodities -- Publications and Newsletters | |
| Working Money, at Working-Money.com -- Publications and Newsletters | |
| Traders.com Advantage -- Publications and Newsletters | |
| Professional Traders Starter Kit -- Software | |
Click here for more information about our publications!
Comments
Date: 04/04/06Rank: 3Comment:
Date: 04/05/06Rank: 5Comment:

Request Information From Our Sponsors
- StockCharts.com, Inc.
- Candle Patterns
- Candlestick Charting Explained
- Intermarket Technical Analysis
- John Murphy on Chart Analysis
- John Murphy's Chart Pattern Recognition
- John Murphy's Market Message
- MurphyExplainsMarketAnalysis-Intermarket Analysis
- MurphyExplainsMarketAnalysis-Visual Analysis
- StockCharts.com
- Technical Analysis of the Financial Markets
- The Visual Investor
- VectorVest, Inc.
- Executive Premier Workshop
- One-Day Options Course
- OptionsPro
- Retirement Income Workshop
- Sure-Fire Trading Systems (VectorVest, Inc.)
- Trading as a Business Workshop
- VectorVest 7 EOD
- VectorVest 7 RealTime/IntraDay
- VectorVest AutoTester
- VectorVest Educational Services
- VectorVest OnLine
- VectorVest Options Analyzer
- VectorVest ProGraphics v6.0
- VectorVest ProTrader 7
- VectorVest RealTime Derby Tool
- VectorVest Simulator
- VectorVest Variator
- VectorVest Watchdog
