HOT TOPICS LIST
- MACD
- Fibonacci
- RSI
- Gann
- ADXR
- Stochastics
- Volume
- Triangles
- Futures
- Cycles
- Volatility
- ZIGZAG
- MESA
- Retracement
- Aroon
INDICATORS LIST
LIST OF TOPICS
PRINT THIS ARTICLE
by David Penn
A breakout in the Dow transports again raises the bar for the Dow industrials. Will the Dow industrials — and the rest of the market — follow suit?
Position: N/A
David Penn
Technical Writer for Technical Analysis of STOCKS & COMMODITIES magazine, Working-Money.com, and Traders.com Advantage.
PRINT THIS ARTICLE
DOW THEORY
Transports Take the Lead (Again)
04/04/06 11:10:02 AMby David Penn
A breakout in the Dow transports again raises the bar for the Dow industrials. Will the Dow industrials — and the rest of the market — follow suit?
Position: N/A
While there are a number of components that make up Dow theory — from the notion that the averages discount everything "save for acts of God" to the idea that volume leads price — the principle of confirmation is one of Dow theory's most commonly remembered — and occasionally most controversial — theories. The principle of confirmation, put simply, is this, as described by Robert Edwards and John Magee in their classic book, Technical Analysis Of Stock Trends:This is the most often questioned and the most difficult to rationalize of all the Dow principles. Yet it has stood the test of time; the fact that it was "worked" is not disputed by any who have carefully examined the records. Those who have disregarded it in practice have, more often than not, had occasion to regret their apostasy. What it means is that no valid signal of a change in trend can be produced by the action of one average alone. |

|
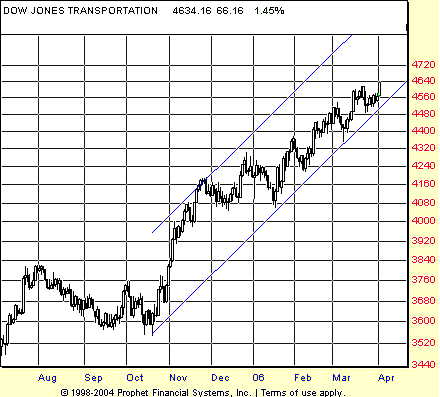
| FIGURE 1: DOW JONES TRANSPORTATION AVERAGE, DAILY. Oil, schmoil. The Dow transports' breakout above the March highs on the first trading day of April shows that transportation stocks continue to be among the leaders of the markets. |
| Graphic provided by: Prophet Financial, Inc. |
| |
| What does this "often-questioned" principle mean in the context of the markets of 2006? I have been indicating that the market was likely to move higher in the first few months of the year. In a number of articles for Traders.com Advantage, I have made this observation from a variety of analytic approaches, including "DLB" or "don't look back" breakouts ("Holding The Breakout," March 30, 2006), Dow theory ("Dow Theory Update," March 9, 2006, and "Confirming Industrials," February 17, 2006), old-fashioned pattern breakouts ("Bounce In February," February 21, 2006, and "The Dow's Tempting Triangle," February 14, 2006), and long-term technical indicators like the moving average convergence/divergence (MACD) histogram ("A Long-Term Look At The S&P 500," February 6, 2006). |
| And with the recent breakout to new highs in the Dow transports, it looks as if another chapter in the market's amazing resilience may need to be plotted. True enough, the new high in the transports, a new high that exceeded the highs of March, will require a new high in the industrials in order to confirm the buy signal that is now only hinted at by the action in the transports. But the fact that the Dow transports are continuing to show strength in the face of uncertainties over the healthy of the economy (that is, second-half recession fears) and the specter of higher oil is a phenomenon that traders and speculators should not overlook. See Figure 1. |

|
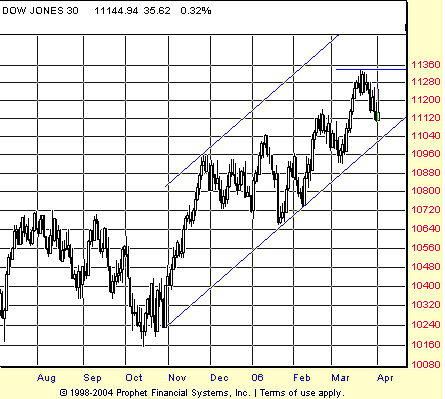
| FIGURE 2: DOW JONES INDUSTRIAL AVERAGE, DAILY. An auspicious April debut turned into a pop 'n' drop, as sellers overwhelmed buyers late in the session. A rally that closes above the 11335 level is what will be required for the industrials to confirm the transports. |
| Graphic provided by: Prophet Financial, Inc. |
| |
| It may prove to have been worth reminding traders and speculators about the transports, because the same-day behavior of the industrials will be sure to command most of the attention. After rallying more than a hundred points in the first few hours, the rally in the industrials stalled and reversed over the course of the afternoon, taking a market that had been up nearly an eye-opening 135 points back down to close at a disappointing-in-context +32 points. As far as dramatic intraday reversals go, the pop 'n' drop of April 3 was impressive in its ability to dash the morning hopes of buyers across the board. |
| The uptrend from the October lows remains intact. The lower boundary of the trend channel shown in Figure 2 has not been broken, nor even seriously threatened since early February. And as disappointing as these kind of intraday reversals are, technical traders should focus on the technical damage that is actually done on a price chart, and not so much on the injuries wrought on hopes, expectations and frayed nerves. Consider this: the last time the Dow made a similar pop 'n' drop was — curiously enough — back on March 3. And like the April 3rd pop 'n' drop, the March 3rd session came about seven days after a short-term top. What is also interesting is that the March session was only three days away from the correction low — and from a rally that took the Dow 30 up to what were then new year-to-date highs. |
Technical Writer for Technical Analysis of STOCKS & COMMODITIES magazine, Working-Money.com, and Traders.com Advantage.
| Title: | Technical Writer |
| Company: | Technical Analysis, Inc. |
| Address: | 4757 California Avenue SW |
| Seattle, WA 98116 | |
| Phone # for sales: | 206 938 0570 |
| Fax: | 206 938 1307 |
| Website: | www.Traders.com |
| E-mail address: | DPenn@traders.com |
Traders' Resource Links | |
| Charting the Stock Market: The Wyckoff Method -- Books | |
| Working-Money.com -- Online Trading Services | |
| Traders.com Advantage -- Online Trading Services | |
| Technical Analysis of Stocks & Commodities -- Publications and Newsletters | |
| Working Money, at Working-Money.com -- Publications and Newsletters | |
| Traders.com Advantage -- Publications and Newsletters | |
| Professional Traders Starter Kit -- Software | |
Click here for more information about our publications!
Comments
Date: 04/04/06Rank: 3Comment:
Date: 04/05/06Rank: 5Comment:

Request Information From Our Sponsors
- StockCharts.com, Inc.
- Candle Patterns
- Candlestick Charting Explained
- Intermarket Technical Analysis
- John Murphy on Chart Analysis
- John Murphy's Chart Pattern Recognition
- John Murphy's Market Message
- MurphyExplainsMarketAnalysis-Intermarket Analysis
- MurphyExplainsMarketAnalysis-Visual Analysis
- StockCharts.com
- Technical Analysis of the Financial Markets
- The Visual Investor
- VectorVest, Inc.
- Executive Premier Workshop
- One-Day Options Course
- OptionsPro
- Retirement Income Workshop
- Sure-Fire Trading Systems (VectorVest, Inc.)
- Trading as a Business Workshop
- VectorVest 7 EOD
- VectorVest 7 RealTime/IntraDay
- VectorVest AutoTester
- VectorVest Educational Services
- VectorVest OnLine
- VectorVest Options Analyzer
- VectorVest ProGraphics v6.0
- VectorVest ProTrader 7
- VectorVest RealTime Derby Tool
- VectorVest Simulator
- VectorVest Variator
- VectorVest Watchdog
