HOT TOPICS LIST
- MACD
- Fibonacci
- RSI
- Gann
- ADXR
- Stochastics
- Volume
- Triangles
- Futures
- Cycles
- Volatility
- ZIGZAG
- MESA
- Retracement
- Aroon
INDICATORS LIST
LIST OF TOPICS
PRINT THIS ARTICLE
by Paolo Pezzutti
Freddie Mac prices accelerate to the downside, pushed by higher interest rates and corporate earning news.
Position: Sell
Paolo Pezzutti
Author of the book "Trading the US Markets - A Comprehensive Guide to US Markets for International Traders and Investors" - Harriman House (July 2008)
PRINT THIS ARTICLE
TECHNICAL ANALYSIS
Freddie Mac Displays Weakness
04/05/06 10:03:05 AMby Paolo Pezzutti
Freddie Mac prices accelerate to the downside, pushed by higher interest rates and corporate earning news.
Position: Sell
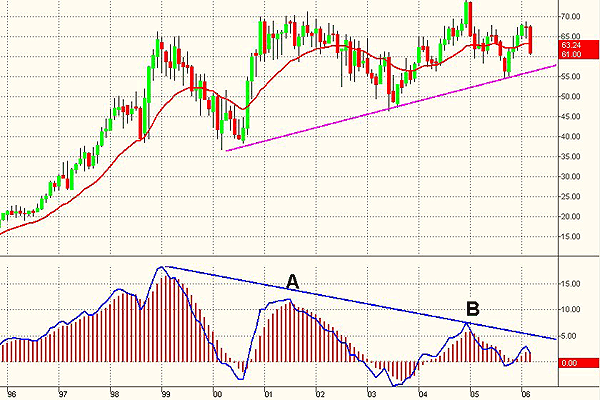
| Freddie Mac's principal activities are to purchase and finance single-family and multifamily residential mortgages and provide mortgage-related services. Figure 1 displays the stock's trend of the past year. In this time frame, the uptrend has been supported by a rising trendline since 2000. With respect to the 1998 high of $66, Freddie Mac has printed new highs in 2001 and 2004 above the $70 level. Each time, however, the new high occurred in coincidence with a significant divergence of the moving average convergence/divergence (MACD) (5,34,5), which I have used in the chart (points A and B). A hammer and a long black candle printed in the past two months have now set a new pivot high and an important resistance for the uptrend resumption. More likely, the stock will continue to the downside to test the trendline, pushed by higher interest rates, to affect the mortgage market. On the newsfront, analysts at Friedman Billings Ramsey downgraded the shares as the company struggled with troublesome margins, continuing accounting issues, and high costs. |

|
| FIGURE 1: FRE, MONTHLY. Negative divergences of MACD provide weakness indications in the intermediate term. |
| Graphic provided by: TradeStation. |
| |
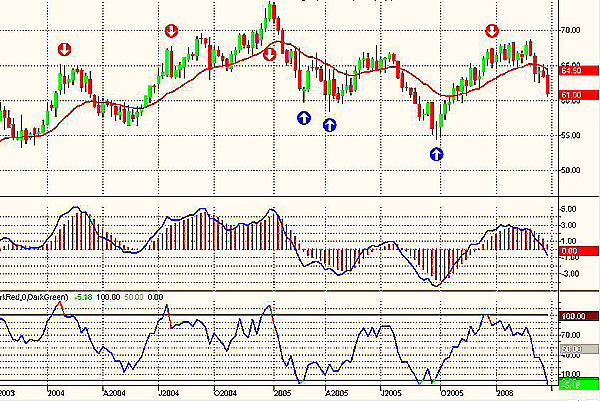
| In Figure 2, the weekly chart shows the lack of directionality of Freddie Mac during the past two years, with prices that have oscillated between the $55 and $70 levels. In these conditions, indicators like the Bollinger %b work well. This indicator can be used to tells us where we are within the Bollinger Bands. The power of it is that you can calculate it not only on the price (typically the close), but also on other indicators. As you can see, its trading indications (red and blue arrows in the figure) worked generally well. As we look at the price action of the past three months, shares after a long distribution phase at the beginning of 2006 moved to the downside, gaining momentum and bringing the %b indicator to a situation of excess. If the behavior that occurred in recent years continues, then we would look for short-term patterns to spot a low-risk entry point. |

|
| FIGURE 2: FRE, WEEKLY. The %b indicator entered the oversold area. Prices moved to the downside to test supports at $60 and $55. |
| Graphic provided by: TradeStation. |
| |
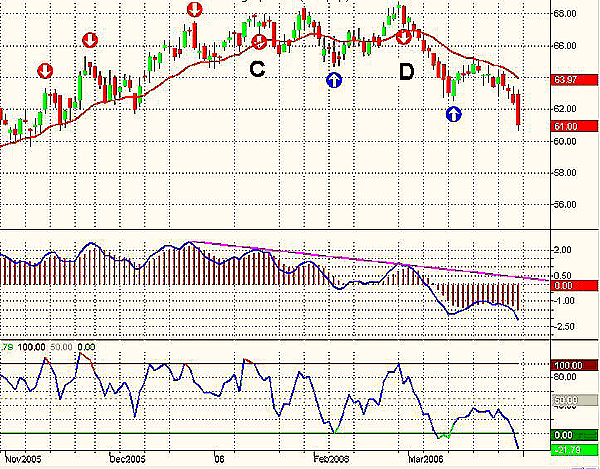
| If we move onto the daily time frame (Figure 3), however, you can see that the technical situation is quite different and requires additional caution before considering opening long positions. Prices initiated an uptrend in September 2005. The move has been smooth and characterized by short corrections. The little swings allowed short-term trading opportunities using the %b indicator (red and blue arrows). Since the end of 2005, the MACD has not been confirming the new highs, printing a series of negative divergences. This fact supported the %b sell indications, especially the ones at points C and D. Recent sessions displayed the stock's weakness, as the Federal Reserve again increased interest rates. The MACD is now negative, indicating an impulse is ongoing, and last Friday, prices accelerated to the downside, printing a long black candle that indicated the more likely direction of prices in the short term. Further, %b is oversold at very low levels. |

|
| FIGURE 3: FRE, DAILY. The stock lost more than 10% in a month, initiating a fast down move. In these conditions, before opening long positions, it is wise to wait for more positive technical conditions. |
| Graphic provided by: TradeStation. |
| |
| The technical situation provides indications of a nondirectional phase in the monthly and weekly time frames, while at the daily level, prices are moving directionally with an increase in volatility. I would not enter a long position at this stage, waiting at least for divergences of %b and/or MACD to be developed in the daily time frame, associated with a short-term chart reversal pattern. Confirming the long-term picture with indications from shorter time frames, it is possible to reduce risks and make decisions in line with the longer-term trend. |
Author of the book "Trading the US Markets - A Comprehensive Guide to US Markets for International Traders and Investors" - Harriman House (July 2008)
| Address: | VIA ROBERTO AGO 26 POSTAL CODE 00166 |
| Rome, ITALY | |
| Phone # for sales: | +393357540708 |
| E-mail address: | pezzutti.paolo@tiscali.it |
Click here for more information about our publications!
Comments
Date: 04/05/06Rank: 3Comment:
Date: 04/06/06Rank: 5Comment:

Request Information From Our Sponsors
- StockCharts.com, Inc.
- Candle Patterns
- Candlestick Charting Explained
- Intermarket Technical Analysis
- John Murphy on Chart Analysis
- John Murphy's Chart Pattern Recognition
- John Murphy's Market Message
- MurphyExplainsMarketAnalysis-Intermarket Analysis
- MurphyExplainsMarketAnalysis-Visual Analysis
- StockCharts.com
- Technical Analysis of the Financial Markets
- The Visual Investor
- VectorVest, Inc.
- Executive Premier Workshop
- One-Day Options Course
- OptionsPro
- Retirement Income Workshop
- Sure-Fire Trading Systems (VectorVest, Inc.)
- Trading as a Business Workshop
- VectorVest 7 EOD
- VectorVest 7 RealTime/IntraDay
- VectorVest AutoTester
- VectorVest Educational Services
- VectorVest OnLine
- VectorVest Options Analyzer
- VectorVest ProGraphics v6.0
- VectorVest ProTrader 7
- VectorVest RealTime Derby Tool
- VectorVest Simulator
- VectorVest Variator
- VectorVest Watchdog
