HOT TOPICS LIST
- MACD
- Fibonacci
- RSI
- Gann
- ADXR
- Stochastics
- Volume
- Triangles
- Futures
- Cycles
- Volatility
- ZIGZAG
- MESA
- Retracement
- Aroon
INDICATORS LIST
LIST OF TOPICS
PRINT THIS ARTICLE
by Koos van der Merwe
Canadian-based Bombardier fell on hard times through poor management and a competitive industry. Is the "dead duck" starting to show signs of life?
Position: Accumulate
Koos van der Merwe
Has been a technical analyst since 1969, and has worked as a futures and options trader with First Financial Futures in Johannesburg, South Africa.
PRINT THIS ARTICLE
CUP WITH HANDLE
Has Bombardier Turned The Corner?
03/30/06 12:08:30 PMby Koos van der Merwe
Canadian-based Bombardier fell on hard times through poor management and a competitive industry. Is the "dead duck" starting to show signs of life?
Position: Accumulate
| Bombardier Inc. is a manufacturer of business jets, regional aircraft, and rail transportation equipment. It also provides financial services and asset management. A recent newspaper article quoted a company executive that jet sales has put Bombardier back in the black, with a stronger-than-expected fourth-quarter showing and a return to profitability for the year — signs that the recovery of the battered plane and trainmaker is under way. |
| And many investors who believed in the company and held their shares as it fell from a high of $26.76 in August 2000 to a low of $1.87 by August 2004 heaved a sigh of relief. The question on everybody's lips, however, is: Is this the start of a true recovery? Will I get my money back? |

|
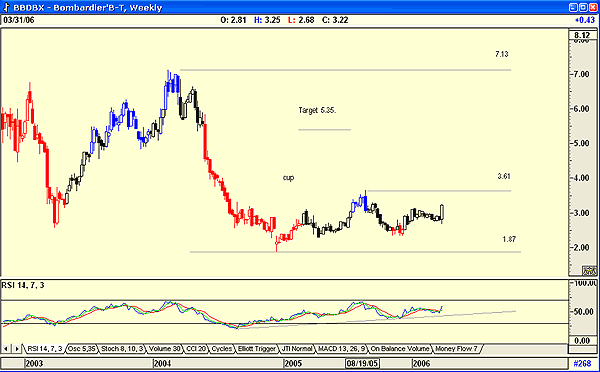
| FIGURE 1: BOMBARDIER, WEEKLY. This Bombardier chart is showing a clear cup & handle formation. |
| Graphic provided by: AdvancedGET. |
| |
| When you look at Figure 1, a weekly chart of Bombardier, the first thing that catches your eye is the cup & handle formation that has formed. With the present price at $3.22, the top of the handle (that is, the buy signal, should the price break above it) at $3.61 looks less formidable than it did over the past six months. Should the price eventually and hopefully break above it, the suggested target is $5.35 (3.61 - 1.87 = 1.74 + 3.61 = 5.35), well below the major resistance of $7.13. The relative strength index (RSI) is also strengthening, suggesting that the share price could reach that target before pausing for breath. |

|
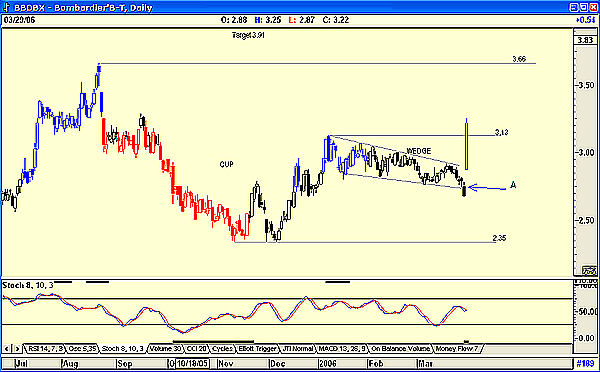
| FIGURE 2: BOMBARDIER, DAILY. This daily chart is showing a lesser cup & handle formation, plus a falling wedge. |
| Graphic provided by: AdvancedGET. |
| |
| A look at Bombardier's daily chart gives a slightly different picture (Figure 2). What could be a cup & handle formation can be seen, suggesting a target of $3.91 (3.13 - 2.35 = 0.78 + 3.13 = 3.91) well above the resistance level of $3.66. You can see how the price broke strongly above the handle as the news of March 30 was released. This move was also confirmed by the stochastic indicator, which is showing strength. What could have led us astray, and possibly did, was the falling wedge formation, and the break below the lower trend line of the wedge at point A. |
| So, would you be a buyer of Bombardier at present levels? I would wait for a correction, possibly a retest of the resistance at $3.13, before buying. I would also watch my stochastic indicator closely for confirmation. Bombardier is definitely a company on the recovery trail and worth holding. |
Has been a technical analyst since 1969, and has worked as a futures and options trader with First Financial Futures in Johannesburg, South Africa.
| Address: | 3256 West 24th Ave |
| Vancouver, BC | |
| Phone # for sales: | 6042634214 |
| E-mail address: | petroosp@gmail.com |
Click here for more information about our publications!
Comments
Date: 03/31/06Rank: 4Comment:
Date: 04/04/06Rank: 5Comment:

Request Information From Our Sponsors
- VectorVest, Inc.
- Executive Premier Workshop
- One-Day Options Course
- OptionsPro
- Retirement Income Workshop
- Sure-Fire Trading Systems (VectorVest, Inc.)
- Trading as a Business Workshop
- VectorVest 7 EOD
- VectorVest 7 RealTime/IntraDay
- VectorVest AutoTester
- VectorVest Educational Services
- VectorVest OnLine
- VectorVest Options Analyzer
- VectorVest ProGraphics v6.0
- VectorVest ProTrader 7
- VectorVest RealTime Derby Tool
- VectorVest Simulator
- VectorVest Variator
- VectorVest Watchdog
- StockCharts.com, Inc.
- Candle Patterns
- Candlestick Charting Explained
- Intermarket Technical Analysis
- John Murphy on Chart Analysis
- John Murphy's Chart Pattern Recognition
- John Murphy's Market Message
- MurphyExplainsMarketAnalysis-Intermarket Analysis
- MurphyExplainsMarketAnalysis-Visual Analysis
- StockCharts.com
- Technical Analysis of the Financial Markets
- The Visual Investor
