HOT TOPICS LIST
- MACD
- Fibonacci
- RSI
- Gann
- ADXR
- Stochastics
- Volume
- Triangles
- Futures
- Cycles
- Volatility
- ZIGZAG
- MESA
- Retracement
- Aroon
INDICATORS LIST
LIST OF TOPICS
PRINT THIS ARTICLE
by David Penn
The meandering of the Standard & Poor's 500 in recent days may be a positive.
Position: N/A
David Penn
Technical Writer for Technical Analysis of STOCKS & COMMODITIES magazine, Working-Money.com, and Traders.com Advantage.
PRINT THIS ARTICLE
BREAKOUTS
Holding The Breakout
03/30/06 10:24:20 AMby David Penn
The meandering of the Standard & Poor's 500 in recent days may be a positive.
Position: N/A
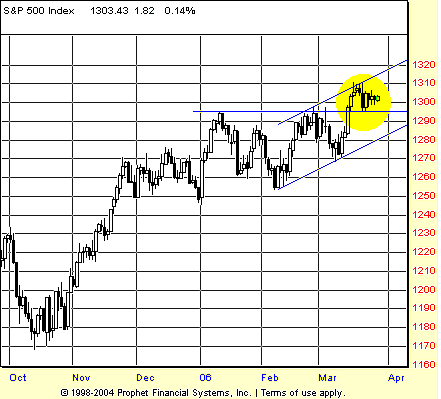
| The March 14th breakout set a new, year-to-date closing high in the Standard & Poor's 500. Never mind that the Dow transports have been setting new, all-time highs every month since November 2005, or that the Russell 2000 started setting new, all-time highs a year before that. The fact that the S&P 500 so far has managed to break out above the widely suffered trading range of the first few months of 2006 should make any technician take notice (Figure 1). |

|
| FIGURE 1: STANDARD & POOR'S 500, DAILY. The S&P 500 finds support at the level from which it broke free in mid-March — roughly 1295. At the upper end of a trend channel that extends from the early February lows, the S&P 500 could easily continue to move sideways for days without violating the short-term uptrend. |
| Graphic provided by: Prophet Financial, Inc. |
| |
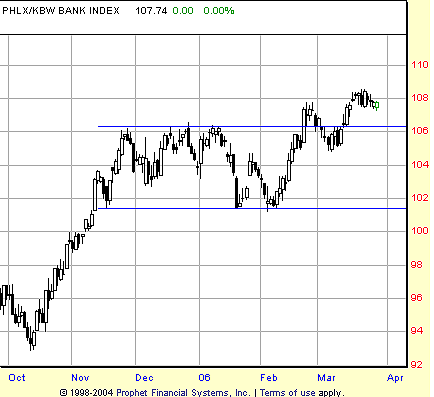
| I've mentioned the breakout in the financial sector previously ("Can't Beat The Banks," Traders.com Advantage). That initial breakout failed, as the $BKX sank back into the rectangular consolidation. But it appears that breakout buyers might have been more early than incorrect. The $BKX, after slipping briefly beneath the upper boundary of the consolidation, rallied back to breakout once again, recently consolidating above the level of the initial failed move higher (Figure 2). |

|
| FIGURE 2: PHILADELPHIA BANKING INDEX, DAILY. The premature breakout is apparent as the consolidation becomes wide and loose in late January. That increase in volatility also suggests the potential for a larger move than might have been expected from the consolidation that began in December 2005. |
| Graphic provided by: Prophet Financial, Inc. |
| |
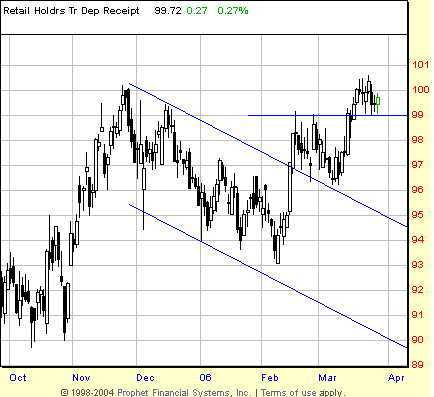
| It is worth noting that not only have the banks performed well since mid-March, but also retail stocks as well. Retail stocks (as measured by the RTH) have been correcting since a top in November 2005, falling some 7% into the February lows. These stocks bounced in the second half of February, setting a new year-to-date high, but not taking out the previous rally peak from November. A short-term correction followed. And as the mid-March lows arrived, retail stocks found a bottom and began to move higher, eventually taking out those November highs. As with the banks, the bullishness of the retail sector is a sign that financial activity — namely, borrowing — is sufficiently robust to keep the markets from softening too greatly in the near term. See Figure 3. |

|
| FIGURE 3: RETAIL HOLDRS, DAILY. A bull flag from late February to early March helps set up a continuation of the rally that began in the first half of February. Note also how the breakout above the high of the flag in mid-March continues to hold above the breakout level of approximately 99. Given the recent taking out of the November highs, a consolidation at this level seems like a sensible response by buyers and sellers. |
| Graphic provided by: Prophet Financial, Inc. |
| |
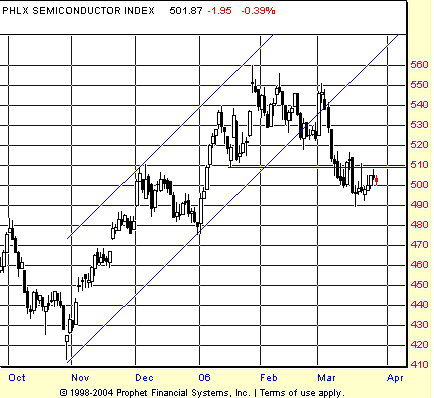
| If there is a fly in the bullish ointment, then that fly might be the semiconductor sector (Figure 4). The underperformance of this sector quite likely is responsible for the lackluster performance of the NASDAQ, particularly the NASDAQ 100, in recent weeks. While the mid-March bottom also occurred in the semiconductor index ($SOX), the bounce from those lows has been less than fully inspiring. This is especially so for those who are anticipating a continuation of the move from the October 2005 lows (a move that arguably was interrupted by the December 2005–February 2006 sideways correction). |

|
| FIGURE 4: PHILADELPHIA SEMICONDUCTOR INDEX, DAILY. While other sectors have held their breakout, semiconductor stocks — as measured by the $SOX — seem unable to rally above their breakdown level from early March. Underperformance in this sector has contributed to the lag in the NASDAQ relative to the S&P 500 and Dow Jones industrials. |
| Graphic provided by: Prophet Financial, Inc. |
| |
| Looking back to the chart of the S&P 500 in Figure 1, it is clear that the markets have not truly had a sharp correction in some time. In the intermediate term, the market is still in bull market mode from the October 2005 bottom. On the shorter term, the market is still creating higher lows and higher highs since the February 2006 bottom. If the market is to continue moving higher, then it is quite possible that the sideways action we've seen in recent days is serving the same sort of function as a sharp correction typically does — allowing weak hands to leave the market and stronger hands to enter. As long as the various breakout levels hold (or, if they are breached, are immediately "restored," as was the case in the S&P 500 on March 29), then this scenario of a market that will continue to move higher in the near term will remain plausible. |
Technical Writer for Technical Analysis of STOCKS & COMMODITIES magazine, Working-Money.com, and Traders.com Advantage.
| Title: | Technical Writer |
| Company: | Technical Analysis, Inc. |
| Address: | 4757 California Avenue SW |
| Seattle, WA 98116 | |
| Phone # for sales: | 206 938 0570 |
| Fax: | 206 938 1307 |
| Website: | www.Traders.com |
| E-mail address: | DPenn@traders.com |
Traders' Resource Links | |
| Charting the Stock Market: The Wyckoff Method -- Books | |
| Working-Money.com -- Online Trading Services | |
| Traders.com Advantage -- Online Trading Services | |
| Technical Analysis of Stocks & Commodities -- Publications and Newsletters | |
| Working Money, at Working-Money.com -- Publications and Newsletters | |
| Traders.com Advantage -- Publications and Newsletters | |
| Professional Traders Starter Kit -- Software | |
Click here for more information about our publications!
Comments
Date: 03/30/06Rank: 3Comment:
Date: 03/31/06Rank: 5Comment:

Request Information From Our Sponsors
- StockCharts.com, Inc.
- Candle Patterns
- Candlestick Charting Explained
- Intermarket Technical Analysis
- John Murphy on Chart Analysis
- John Murphy's Chart Pattern Recognition
- John Murphy's Market Message
- MurphyExplainsMarketAnalysis-Intermarket Analysis
- MurphyExplainsMarketAnalysis-Visual Analysis
- StockCharts.com
- Technical Analysis of the Financial Markets
- The Visual Investor
- VectorVest, Inc.
- Executive Premier Workshop
- One-Day Options Course
- OptionsPro
- Retirement Income Workshop
- Sure-Fire Trading Systems (VectorVest, Inc.)
- Trading as a Business Workshop
- VectorVest 7 EOD
- VectorVest 7 RealTime/IntraDay
- VectorVest AutoTester
- VectorVest Educational Services
- VectorVest OnLine
- VectorVest Options Analyzer
- VectorVest ProGraphics v6.0
- VectorVest ProTrader 7
- VectorVest RealTime Derby Tool
- VectorVest Simulator
- VectorVest Variator
- VectorVest Watchdog
