HOT TOPICS LIST
- MACD
- Fibonacci
- RSI
- Gann
- ADXR
- Stochastics
- Volume
- Triangles
- Futures
- Cycles
- Volatility
- ZIGZAG
- MESA
- Retracement
- Aroon
INDICATORS LIST
LIST OF TOPICS
PRINT THIS ARTICLE
by Arthur Hill
IBM broke resistance with a surge in March, and a return to this breakout offers a second chance to partake in the new uptrend.
Position: Accumulate
Arthur Hill
Arthur Hill is currently editor of TDTrader.com, a website specializing in trading strategies, sector/industry specific breadth stats and overall technical analysis. He passed the Society of Technical Analysts (STA London) diploma exam with distinction is a Certified Financial Technician (CFTe). Prior to TD Trader, he was the Chief Technical Analyst for Stockcharts.com and the main contributor to the ChartSchool.
PRINT THIS ARTICLE
STOCHASTIC OSCILL
IBM Returns To Breakout
03/30/06 08:12:12 AMby Arthur Hill
IBM broke resistance with a surge in March, and a return to this breakout offers a second chance to partake in the new uptrend.
Position: Accumulate
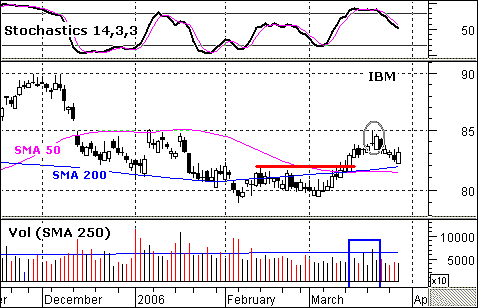
| I first profiled IBM in early March as the stock consolidated below resistance and two key moving averages. The 50-day simple moving average (SMA), 200-day SMA, and mid-February high all came together to mark resistance around 81-82 (Figure 1). The stock began to surge the second week of March and broke through resistance with a strong move above 84. Volume was relatively low, but managed to pick up at the end of the advance. Despite modest volume, the breakout is bullish until proven otherwise and points to higher prices over the next few weeks. |

|
| FIGURE 1: IBM. The stock surged in mid-March and broke through resistance with a strong move above 84. |
| Graphic provided by: MetaStock. |
| Graphic provided by: MS Quotecenter. |
| |
| On the first move above 84, Big Blue formed a doji, and this signaled sudden indecision (gray oval). This indecision turned into weakness as the stock declined to around 82. Given the prior advance, some sort of pullback is perfectly normal and traders should identify pullback support levels that may offer a second chance to partake in an advance. The prior reasons for resistance now become the basis for support. The 50-day SMA and 200-day SMA remain in the 81-82 area, and these should now be considered support. In addition, broken resistance at 82 extends and should also be considered support. |
| Support is one thing and a continuation of the advance is another. The stock firmed on March 29 with a bullish engulfing day. This occurs when the open is below the prior close and the close is above the prior open. The white candlestick engulfed the prior black candlestick, and this is the start of a short-term reversal. Even so, I would still like to see some follow-through, so I turned to the stochastic oscillator. This is quite sensitive and pulled back to around 50 over the past two weeks. It remains below its signal line (magenta line) and I am looking for an upturn above this signal line for a bullish trigger. |
Arthur Hill is currently editor of TDTrader.com, a website specializing in trading strategies, sector/industry specific breadth stats and overall technical analysis. He passed the Society of Technical Analysts (STA London) diploma exam with distinction is a Certified Financial Technician (CFTe). Prior to TD Trader, he was the Chief Technical Analyst for Stockcharts.com and the main contributor to the ChartSchool.
| Title: | Editor |
| Company: | TDTrader.com |
| Address: | Willem Geetsstraat 17 |
| Mechelen, B2800 | |
| Phone # for sales: | 3215345465 |
| Website: | www.tdtrader.com |
| E-mail address: | arthurh@tdtrader.com |
Traders' Resource Links | |
| TDTrader.com has not added any product or service information to TRADERS' RESOURCE. | |
Click here for more information about our publications!
Comments
Date: 03/30/06Rank: 4Comment:
Date: 04/04/06Rank: 4Comment:

Request Information From Our Sponsors
- StockCharts.com, Inc.
- Candle Patterns
- Candlestick Charting Explained
- Intermarket Technical Analysis
- John Murphy on Chart Analysis
- John Murphy's Chart Pattern Recognition
- John Murphy's Market Message
- MurphyExplainsMarketAnalysis-Intermarket Analysis
- MurphyExplainsMarketAnalysis-Visual Analysis
- StockCharts.com
- Technical Analysis of the Financial Markets
- The Visual Investor
- VectorVest, Inc.
- Executive Premier Workshop
- One-Day Options Course
- OptionsPro
- Retirement Income Workshop
- Sure-Fire Trading Systems (VectorVest, Inc.)
- Trading as a Business Workshop
- VectorVest 7 EOD
- VectorVest 7 RealTime/IntraDay
- VectorVest AutoTester
- VectorVest Educational Services
- VectorVest OnLine
- VectorVest Options Analyzer
- VectorVest ProGraphics v6.0
- VectorVest ProTrader 7
- VectorVest RealTime Derby Tool
- VectorVest Simulator
- VectorVest Variator
- VectorVest Watchdog
