HOT TOPICS LIST
- MACD
- Fibonacci
- RSI
- Gann
- ADXR
- Stochastics
- Volume
- Triangles
- Futures
- Cycles
- Volatility
- ZIGZAG
- MESA
- Retracement
- Aroon
INDICATORS LIST
LIST OF TOPICS
PRINT THIS ARTICLE
by Gary Grosschadl
After reaching a multiyear high above $49 in December 2005, Citigroup corrected to $45 and now is on an upleg again, nearing a target.
Position: Hold
Gary Grosschadl
Independent Canadian equities trader and technical analyst based in Peterborough
Ontario, Canada.
PRINT THIS ARTICLE
ANDREWS PITCH-FORK
Citigroup Nears Upside Target
03/30/06 08:01:45 AMby Gary Grosschadl
After reaching a multiyear high above $49 in December 2005, Citigroup corrected to $45 and now is on an upleg again, nearing a target.
Position: Hold
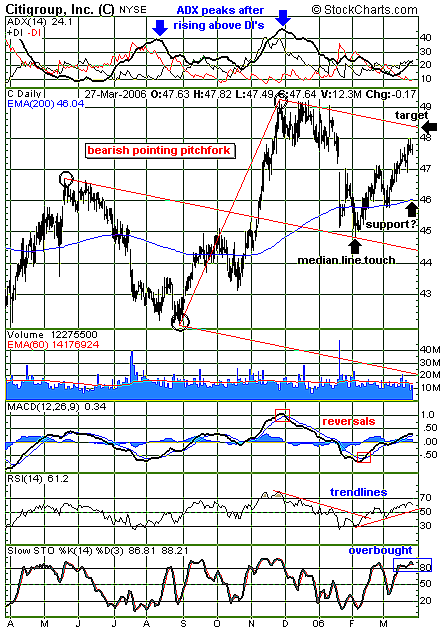
| On this daily chart (Figure 1), an Andrews pitchfork determines likely resistance and support levels. This charting method, named after Alan Andrews, is a line study consisting of three parallel trendlines based on three selected turning points (see circled points). The interpretation of a pitchfork is based on normal trendline support and resistance principles. Prices tend to "walk along" the trendlines bouncing between the "tines" of the fork until there is significant trend change. A significant trend change alters the nature of the fork from downward pointing (bearish) to upward pointing (bullish) or vice versa. |
| In a longer-term view, this bearish pointing pitchfork could also be interpreted as a larger sideways trend. This chart shows a perfect bounce at the center median line, and now the upper target is within reach. A reversal at or near this 48.40 level could lead to another downleg to once again test the middle "tine." It is noted, however, that possible support could be offered by the often significant 200-day exponential moving average (EMA). The more often these median line "touches" are respected, the stronger the significance is to the trader trying to capitalize on these price swings. Typically, it is safer and more reliable to honor the adage "Buy on support and sell at resistance." |

|
| FIGURE 1: CITIGROUP, DAILY. This pitchfork analysis of C shows a resistance target. |
| Graphic provided by: StockCharts.com. |
| |
| Several indicators are also considered. At the top of the chart, the three components of this directional movement indicator (created by technician J. Welles Wilder) can be seen. The average directional movement ndex (ADX) is a measure of trend strength, while the directional movement indicators (DIs) represent bullish/positive power or bearish/negative power. Note that significant reversals often occur after the ADX rises above both DIs (hinting at an overextended move) and then comes off a peak, with the DIs converging. The current situation may be approaching such conditions, albeit with a much lower peak. |
| The moving average convergence/divergence (MACD) shows a possible pause developing just above the zero line. Note the good reversal signals from previous turns. The relative strength index (RSI), with its more sensitive character, lends itself to trendline analysis in certain instances. This is a good example with the last bounce off the chart's median line. Likewise, an eventual break in the RSI trendline could be a reliable signal of the next downturn. In addition, the stochastics oscillator currently shows an overbought condition, a move below the 80 level that is the normal signal of a stochastic downturn under way. |
| In summary, in the near future the next turn for this stock cannot be far off if this pitchfork analysis holds true. A convincing break above the upper median line would indicate a bullish trend change, and a new pitchfork could be drawn. |
Independent Canadian equities trader and technical analyst based in Peterborough
Ontario, Canada.
| Website: | www.whatsonsale.ca/financial.html |
| E-mail address: | gwg7@sympatico.ca |
Click here for more information about our publications!
Comments
Date: 03/30/06Rank: 5Comment:

Request Information From Our Sponsors
- StockCharts.com, Inc.
- Candle Patterns
- Candlestick Charting Explained
- Intermarket Technical Analysis
- John Murphy on Chart Analysis
- John Murphy's Chart Pattern Recognition
- John Murphy's Market Message
- MurphyExplainsMarketAnalysis-Intermarket Analysis
- MurphyExplainsMarketAnalysis-Visual Analysis
- StockCharts.com
- Technical Analysis of the Financial Markets
- The Visual Investor
- VectorVest, Inc.
- Executive Premier Workshop
- One-Day Options Course
- OptionsPro
- Retirement Income Workshop
- Sure-Fire Trading Systems (VectorVest, Inc.)
- Trading as a Business Workshop
- VectorVest 7 EOD
- VectorVest 7 RealTime/IntraDay
- VectorVest AutoTester
- VectorVest Educational Services
- VectorVest OnLine
- VectorVest Options Analyzer
- VectorVest ProGraphics v6.0
- VectorVest ProTrader 7
- VectorVest RealTime Derby Tool
- VectorVest Simulator
- VectorVest Variator
- VectorVest Watchdog
