

HOT TOPICS LIST
- MACD
- Fibonacci
- RSI
- Gann
- ADXR
- Stochastics
- Volume
- Triangles
- Futures
- Cycles
- Volatility
- ZIGZAG
- MESA
- Retracement
- Aroon
INDICATORS LIST
LIST OF TOPICS
PRINT THIS ARTICLE
by David Penn
Being overbought has its benefits for Boeing in 2006.
Position: N/A
David Penn
Technical Writer for Technical Analysis of STOCKS & COMMODITIES magazine, Working-Money.com, and Traders.com Advantage.
PRINT THIS ARTICLE
OVERBOUGHT OVERSOLD
Boeing's Beautiful BOSO Breakouts
03/29/06 11:56:34 AMby David Penn
Being overbought has its benefits for Boeing in 2006.
Position: N/A
| One of the most important things a trader should keep in mind was said decades ago by the legendary (and ultimately tragic) trader Jesse Livermore. He observed that stocks were "never too high to buy and never too low to sell." This is really just another version of the market axiom that the "trend is your friend." But so central is this idea to successful trading that I'll take whatever iterations of it I can get. |
|
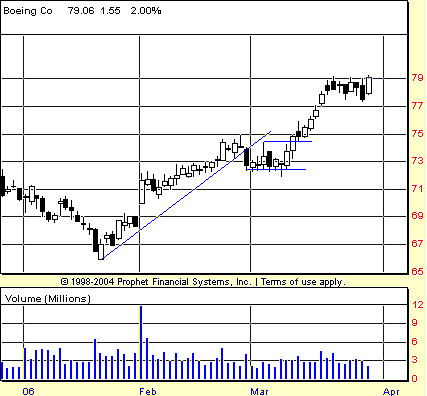
| FIGURE 1: BOEING, DAILY. A 1-2-3 trend reversal analysis helped traders avoid selling Boeing when it slipped into a sideways consolidation in the first half of March. |
| Graphic provided by: Prophet Financial, Inc. |
| |
| As I wrote for Working-Money.com, the BOSO screen is one of the more effective ways for traders to take advantage of trending markets — especially those that are either (a) early in their trends, when skeptics abound, or (b) late in their trends, when the move is typically said to have already gone "too far, too fast." The BOSO screen, derived from the work of Price Headley (bigtrends.com) in a seminar he gave in the summer of 2005, helps traders remember that markets that are "too high" or "too low" by dint of some reading on an indicator are often about to make the sort of major moves that speculators hope for every time they put on a trade. Why rule out a market, as many do who warn of "overbought" and "oversold" conditions, when it might be preparing to blast off? |
| Before looking at the BOSO screen and Boeing's two advances in 2006, I want to show how even conventional technical analysis would have caught Boeing's bullishness. Note how in Figure 1, Boeing (BA) was in an uptrend from the late January lows. This uptrend was truly precipitated by the high-volume gap up in earliest February and extended over the course of the month. Moving into March, however, Boeing broke down below the uptrend line, providing an opportunity for bears to take the stock lower. However, as we know from 1-2-3 trend reversal analysis, the fact that BA never closed below the low of the trendline-breaking correction (a low of approximately 72.36) meant that the "correction" was more likely just a pullback in a bull market. When BA advanced to close above the previous rally high of 75 in mid-March, the bull market was confirmed and the uptrend reestablished. |
|
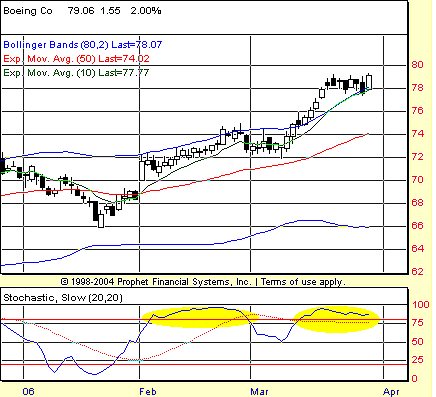
| FIGURE 2: BOEING, DAILY. Stochastic breakouts in February and in March anticipated further gains in overbought Boeing shares. |
| Graphic provided by: Prophet Financial, Inc. |
| |
| A similar phenomenon appears to be happening in late March with BA. The post-Fed announcement selloff created a breach of the trendline that connects the lows of early March to the highs of late March. However, rather than follow through to the downside, BA moved sharply higher to take out the previous rally high on a closing basis (at least as of this writing). As was the case in mid-March, this is a bullish sign for Boeing in the near term. |
| Now note what the BOSO screens show of BA in these same time frames. The period of the BOSO/stochastic breakout is highlighted in yellow (Figure 2). In February, BA had a stochastic breakout on February 3 that was confirmed on February 10 with a close of 72.53. BA rallied to 74.39 (closing basis) on February 22. But even as BA pulled back and slipped from its overbought condition on March 1, the stock never closed below the low of the session when this occurred (a low of 72.36). I consider this akin to the fact that, in the previous example with the 1-2-3 trendline reversal, it was a failure of the bears to secure a close below the low of the trendline-breaking correction that helped keep bulls in Boeing — which is where they belonged. The second breakout in the second half of March may prove to be even more impressive. Whether the bulls of February were the bulls of March, mid-March provided a clear breakout into overbought territory on March 14 with confirmation on the following day with a close of 76.05. BA has since rallied to as high as 78.73 on a closing basis. Even with the post-Fed announcement correction, BA never slipped from its overbought, "never too high to buy" state. |
Technical Writer for Technical Analysis of STOCKS & COMMODITIES magazine, Working-Money.com, and Traders.com Advantage.
| Title: | Technical Writer |
| Company: | Technical Analysis, Inc. |
| Address: | 4757 California Avenue SW |
| Seattle, WA 98116 | |
| Phone # for sales: | 206 938 0570 |
| Fax: | 206 938 1307 |
| Website: | www.Traders.com |
| E-mail address: | DPenn@traders.com |
Traders' Resource Links | |
| Charting the Stock Market: The Wyckoff Method -- Books | |
| Working-Money.com -- Online Trading Services | |
| Traders.com Advantage -- Online Trading Services | |
| Technical Analysis of Stocks & Commodities -- Publications and Newsletters | |
| Working Money, at Working-Money.com -- Publications and Newsletters | |
| Traders.com Advantage -- Publications and Newsletters | |
| Professional Traders Starter Kit -- Software | |
Click here for more information about our publications!
Comments
Date:�03/29/06Rank:�3Comment:�

Request Information From Our Sponsors
- StockCharts.com, Inc.
- Candle Patterns
- Candlestick Charting Explained
- Intermarket Technical Analysis
- John Murphy on Chart Analysis
- John Murphy's Chart Pattern Recognition
- John Murphy's Market Message
- MurphyExplainsMarketAnalysis-Intermarket Analysis
- MurphyExplainsMarketAnalysis-Visual Analysis
- StockCharts.com
- Technical Analysis of the Financial Markets
- The Visual Investor
- VectorVest, Inc.
- Executive Premier Workshop
- One-Day Options Course
- OptionsPro
- Retirement Income Workshop
- Sure-Fire Trading Systems (VectorVest, Inc.)
- Trading as a Business Workshop
- VectorVest 7 EOD
- VectorVest 7 RealTime/IntraDay
- VectorVest AutoTester
- VectorVest Educational Services
- VectorVest OnLine
- VectorVest Options Analyzer
- VectorVest ProGraphics v6.0
- VectorVest ProTrader 7
- VectorVest RealTime Derby Tool
- VectorVest Simulator
- VectorVest Variator
- VectorVest Watchdog