

HOT TOPICS LIST
- MACD
- Fibonacci
- RSI
- Gann
- ADXR
- Stochastics
- Volume
- Triangles
- Futures
- Cycles
- Volatility
- ZIGZAG
- MESA
- Retracement
- Aroon
INDICATORS LIST
LIST OF TOPICS
PRINT THIS ARTICLE
by David Penn
As the mid-March lows hint at a bottom in gold, gold stocks head higher.
Position: N/A
David Penn
Technical Writer for Technical Analysis of STOCKS & COMMODITIES magazine, Working-Money.com, and Traders.com Advantage.
PRINT THIS ARTICLE
REVERSAL
The Gold Bug Bounce
03/29/06 08:30:23 AMby David Penn
As the mid-March lows hint at a bottom in gold, gold stocks head higher.
Position: N/A
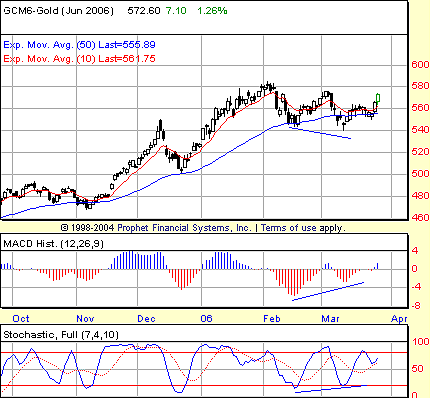
| It appears more and more likely that gold established a "trading" or short-term bottom in mid-March. In fact, it could be argued that gold futures (basis June) created a bullish, short-term 2B bottom during the trough-making declines of February and March 2006. The fact that the lower price trough in March was accompanied by higher price troughs in both the stochastic and the moving average convergence/divergence (MACD) histogram only adds support to the argument that the correction in gold that began in late January has, for the time being, run its course. |
|
| FIGURE 1: JUNE GOLD FUTURES, DAILY. Positive divergences in the stochastic and MACD histogram help anticipate a bullish resolution to gold's break below the 50-day exponential moving average in early March. |
| Graphic provided by: Prophet Financial, Inc. |
| |
| Generally, I'm a bit suspicious of the bullishness of positive divergences when they accompany minor bottoms, or lows just below major, intermediate-term moving averages like the 50-day exponential moving averages (EMA) (in blue in Figure 1). However, positive divergences are no less capable of anticipating the low of a sideways correction than they are at anticipating the low of a sharper, more vertical correction. That, plus the fact that the divergence in the stochastic is confirmed by a like divergence in the MACD histogram, makes me more willing to buy into the bullish argument suggested by the higher lows in both indicators in March. |
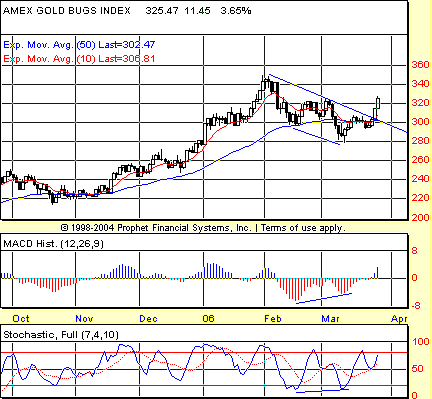
| Another piece of evidence in support of a bottom in gold prices is the behavior of the gold stocks (Figure 2). Here, as measured by $HUI, gold stocks endured one of those sharper, more vertical corrections from late January to early March. Yet the pattern in the stochastic and MACD histogram (that is, a higher low on the second trough) provides the same message to the gold stocks as the pattern in the stochastic and MACD histogram provided to gold futures: higher prices likely in the near term. |
|
| FIGURE 2: AMEX GOLD BUGS INDEX, DAILY. Here's a sharper correction in the gold stocks relative to the gold futures, but the implications of higher prices for both stocks and gold futures are the same. |
| Graphic provided by: Prophet Financial, Inc. |
| |
| One of the tools I have been incorporating into my own work comes from the work of Tim Wood of Cycles News & Views (http://www.cyclesman.com). Combined with technical indicators I trust and other factors, Wood's work on cycles has helped me think of various markets not just in terms of price and volume, but also in terms of time and cyclicality. Wood's cycle analysis gives me a time frame in which various market events can be expected to occur. When Wood talks about the timing "window" for a given market opening, for example, then I know that I will be especially rewarded for careful scrutiny of my technical indicators. Nearing a trading (or seasonal or intermediate) term low? I start looking for positive divergences, moving average or past-peak support, bullish candlestick patterns and so on. More often than not, a cyclical high or low will be anticipated by any one of the many worthwhile technical indicators, chart patterns, or sentiment analysis that market technicians use on a regular basis. |
| As such, I became very interested in the possibility of a low in gold and the gold stocks late in February or early in March. Increasingly, it appears as if that low was in early March, marked by short-term penetration of the 50-day EMA, longer-than-normal lower "shadows" on the candlesticks, and, of course, the positive divergences in the stochastic and MACD histogram. What this means — or has meant ever since that low was established on March 10 — is that gold stocks have been buyable at a relatively low risk for the past few trading weeks. That risk will increase as gold moves toward its next cyclical high as both the $HUI and gold futures begin their march higher toward a test of year-to-date highs. |
Technical Writer for Technical Analysis of STOCKS & COMMODITIES magazine, Working-Money.com, and Traders.com Advantage.
| Title: | Technical Writer |
| Company: | Technical Analysis, Inc. |
| Address: | 4757 California Avenue SW |
| Seattle, WA 98116 | |
| Phone # for sales: | 206 938 0570 |
| Fax: | 206 938 1307 |
| Website: | www.Traders.com |
| E-mail address: | DPenn@traders.com |
Traders' Resource Links | |
| Charting the Stock Market: The Wyckoff Method -- Books | |
| Working-Money.com -- Online Trading Services | |
| Traders.com Advantage -- Online Trading Services | |
| Technical Analysis of Stocks & Commodities -- Publications and Newsletters | |
| Working Money, at Working-Money.com -- Publications and Newsletters | |
| Traders.com Advantage -- Publications and Newsletters | |
| Professional Traders Starter Kit -- Software | |
Click here for more information about our publications!
Comments
Date:�03/29/06Rank:�4Comment:�
Date:�03/30/06Rank:�5Comment:�

Request Information From Our Sponsors
- StockCharts.com, Inc.
- Candle Patterns
- Candlestick Charting Explained
- Intermarket Technical Analysis
- John Murphy on Chart Analysis
- John Murphy's Chart Pattern Recognition
- John Murphy's Market Message
- MurphyExplainsMarketAnalysis-Intermarket Analysis
- MurphyExplainsMarketAnalysis-Visual Analysis
- StockCharts.com
- Technical Analysis of the Financial Markets
- The Visual Investor
- VectorVest, Inc.
- Executive Premier Workshop
- One-Day Options Course
- OptionsPro
- Retirement Income Workshop
- Sure-Fire Trading Systems (VectorVest, Inc.)
- Trading as a Business Workshop
- VectorVest 7 EOD
- VectorVest 7 RealTime/IntraDay
- VectorVest AutoTester
- VectorVest Educational Services
- VectorVest OnLine
- VectorVest Options Analyzer
- VectorVest ProGraphics v6.0
- VectorVest ProTrader 7
- VectorVest RealTime Derby Tool
- VectorVest Simulator
- VectorVest Variator
- VectorVest Watchdog