HOT TOPICS LIST
- MACD
- Fibonacci
- RSI
- Gann
- ADXR
- Stochastics
- Volume
- Triangles
- Futures
- Cycles
- Volatility
- ZIGZAG
- MESA
- Retracement
- Aroon
INDICATORS LIST
LIST OF TOPICS
PRINT THIS ARTICLE
by Paolo Pezzutti
Here's a methodology to exploit short-term momentum.
Position: N/A
Paolo Pezzutti
Author of the book "Trading the US Markets - A Comprehensive Guide to US Markets for International Traders and Investors" - Harriman House (July 2008)
PRINT THIS ARTICLE
DAY TRADING
Joe Ross And The Ross Hooks
03/28/06 09:27:30 AMby Paolo Pezzutti
Here's a methodology to exploit short-term momentum.
Position: N/A
| In his books, trader Joe Ross proposes an interesting trading methodology. Here is the concept of the Ross hook, which exploits short-term momentum to enter a trade with low- and controlled-risk management. |

|
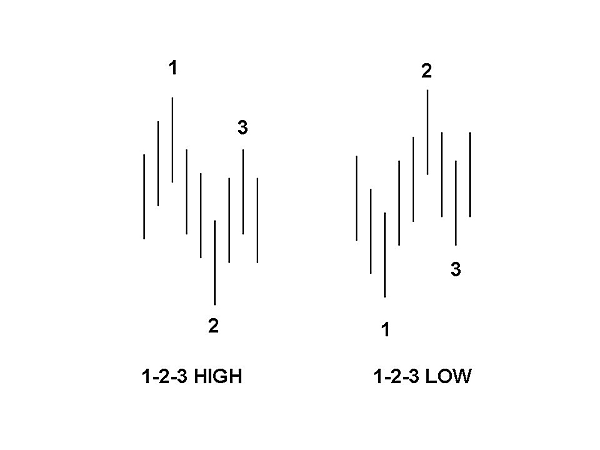
| FIGURE 1: 1-2-3. The 1-2-3 formation is the basic fractal of reversals. |
| Graphic provided by: powerpoint. |
| |
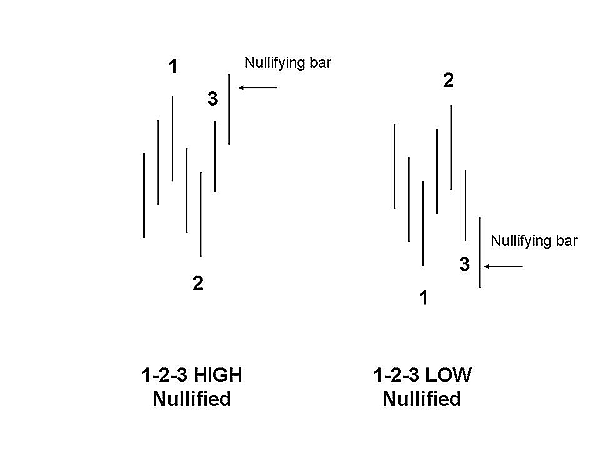
| Typically, a 1-2-3 high forms at the end of an uptrending market (Figure 1). Prices make a final high (point 1) and move downward to point 2, where an upward correction starts. The move continues upward to point 3, where it pivots and resumes a downward movement. You can have more than one bar moving from point 1 to 2, and again from point 2 to 3. A point 1 high is created when a previous up move ends and prices begin to move down. The second and third points of a 1-2-3 high are created when a correction takes place. When it takes more than three bars to form a higher high/low, you are in a congestion. A 1-2-3 formation is nullified when prices move at or beyond the #1 point (Figure 2). The opposite is true for a 1-2-3 low formation; Figure 1 shows typical 1-2-3 formations. |

|
| FIGURE 2: 1-2-3 FORMATION. A 1-2-3 formation is nullified when prices move above point 1 for 1-2-3 highs or below point 1 for 1-2-3 lows, respectively. |
| Graphic provided by: powerpoint. |
| |
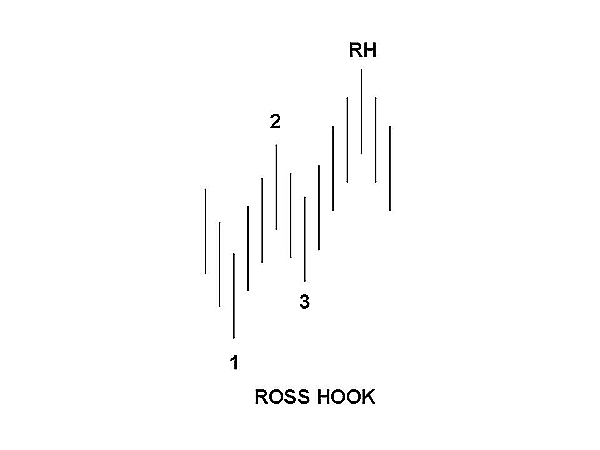
| A Ross hook is formed the first correction after the breakout of a 1-2-3 high/low. In an uptrend, after the breakout of a 1-2-3 low, the failure of a bar to make a new high creates a Ross hook (Figure 3). Similarly, a failure of a bar to print a new low after the breakout of a 1-2-3 high creates a hook. The same concept applies after a breakout of a ledge or a trading range. Joe Ross identified the 1-2-3 formation and paired it with Bollinger Bands. This type of trading works well in a trending environment or a volatile trading range. When volatility is low and the Bollinger Bands are flat, it is probably better to use another trading methodology. Let's see the rules: in an uptrend, prices must touch or exceed the lower Bollinger Band or the moving average before a 1-2-3 formation is in the condition to be traded. In a downtrend, the opposite is true. The entry point is the breakout at point 2. If the 1-2-3 formation is generated at the moving average, you can have the confidence to anticipate the breakout of point 2. In this case, at the breakout, you can already cover your costs, just in case it is a false signal. The exit point normally is the high/low of point 3. |

|
| FIGURE 3: 1-2-3 FORMATION. A Ross hook is formed the first correction after the breakout of a 1-2-3 high/low. |
| Graphic provided by: powerpoint. |
| |
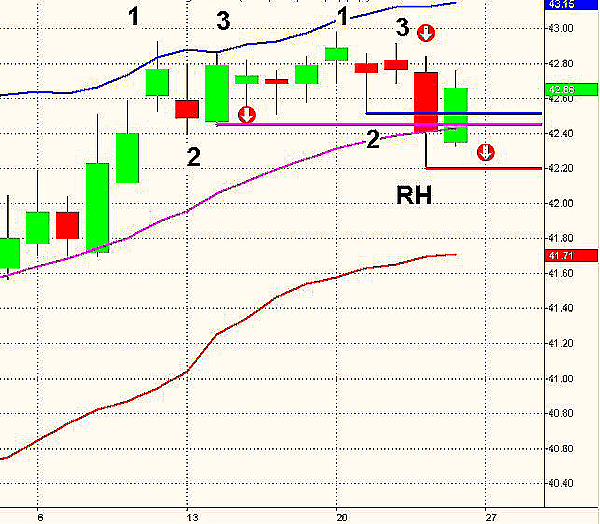
| In Figure 4, you can see the daily chart of Coca-Cola (KO). The stock is in an uptrend in this time frame with prices moving within the upper Bollinger Band and the moving average. On March 10, the stock prints point 1 at the upper band. After one bar of correction (point 2), prices try to retest the previous high at point 1. The test fails and prices move to the downside, printing point 3 on March 14. In this case, you can place your sell-stop order below point 2 or you can anticipate the breakout of point 2. During the next days, the order would not be filled because prices did not gain momentum to the downside and instead moved up above point 1. A second formation is printed a few days later. This time, point 1 on March 20 is not generated at the upper Bollinger Band. Prices correct to the downside, forming point 2, the next day move up to print point 3, and finally generate momentum to the downside. Your sell-stop order below the low of point 2 is triggered on March 23. The next day, which is the last trading session, prices printed a correction to the upside, forming a Ross hook. You can place, according to the methodology, another sell-stop order below the low of the Ross hook bar. Your initial stop-loss would be at the high of point 3. You could apply a trailing stop and move it to breakeven as soon as possible. You could also partly liquidate the position when you are able to cover costs. |

|
| FIGURE 4: COCA-COLA, DAILY. Ross hooks provide risk-controlled entry points. |
| Graphic provided by: powerpoint. |
| |
| This method cannot be applied mechanically. You must evaluate volatility conditions of the market you intend to trade. However, you can apply it on different time frames, exploiting short-term momentum with good risk management characteristics. |
Author of the book "Trading the US Markets - A Comprehensive Guide to US Markets for International Traders and Investors" - Harriman House (July 2008)
| Address: | VIA ROBERTO AGO 26 POSTAL CODE 00166 |
| Rome, ITALY | |
| Phone # for sales: | +393357540708 |
| E-mail address: | pezzutti.paolo@tiscali.it |
Click here for more information about our publications!
Comments
Date: 03/28/06Rank: 3Comment:
Date: 03/29/06Rank: 5Comment:
Date: 06/14/06Rank: 5Comment: ask about ross hook of easylanguage code

Request Information From Our Sponsors
- StockCharts.com, Inc.
- Candle Patterns
- Candlestick Charting Explained
- Intermarket Technical Analysis
- John Murphy on Chart Analysis
- John Murphy's Chart Pattern Recognition
- John Murphy's Market Message
- MurphyExplainsMarketAnalysis-Intermarket Analysis
- MurphyExplainsMarketAnalysis-Visual Analysis
- StockCharts.com
- Technical Analysis of the Financial Markets
- The Visual Investor
- VectorVest, Inc.
- Executive Premier Workshop
- One-Day Options Course
- OptionsPro
- Retirement Income Workshop
- Sure-Fire Trading Systems (VectorVest, Inc.)
- Trading as a Business Workshop
- VectorVest 7 EOD
- VectorVest 7 RealTime/IntraDay
- VectorVest AutoTester
- VectorVest Educational Services
- VectorVest OnLine
- VectorVest Options Analyzer
- VectorVest ProGraphics v6.0
- VectorVest ProTrader 7
- VectorVest RealTime Derby Tool
- VectorVest Simulator
- VectorVest Variator
- VectorVest Watchdog
